Bacterial Sialidase
(All numbering and residues are taken from first PDB file)
![]()
![]()
Bending Residue Dihedral Analysis
Residue
iResidue
i+1Distance of hinge axis to residue i in
(A) Distance of hinge axis to residue i in
(A) Change in
(deg) Change in
(deg) Angle of psi(i) axis to hinge axis
(deg) Angle of psi(i) axis to hinge axis
(deg) Percentage Progress
VAL-413
ALA-414
2.7
2.6
-0.7
9.8
156.2
159.5
11.9
ALA-414
LEU-415
3.8
3.6
-3.5
24.0
128.3
126.2
91.9
LEU-415
GLU-416
1.9
1.4
19.8
-24.6
21.5
19.8
10.6

Graph shows rotational transition at bending residues and can be used
to identify hinge bending residues.
Probably only informative for interdomain rotations greater than 20 degrees
Residue
iResidue
i+1Distance of hinge axis to residue i in
(A) Distance of hinge axis to residue i in
(A) Change in
(deg) Change in
(deg) Angle of psi(i) axis to hinge axis
(deg) Angle of psi(i) axis to hinge axis
(deg) Percentage Progress
THR-422
VAL-423
6.6
6.7
4.9
-8.7
51.0
42.6
-34.4
VAL-423
PRO-424
4.0
4.4
14.4
-10.8
32.6
26.3
80.6
PRO-424
VAL-425
5.1
5.1
-6.9
-1.4
115.2
116.4
27.3

Graph shows rotational transition at bending residues and can be used
to identify hinge bending residues.
Probably only informative for interdomain rotations greater than 20 degrees
Residue
iResidue
i+1Distance of hinge axis to residue i in
(A) Distance of hinge axis to residue i in
(A) Change in
(deg) Change in
(deg) Angle of psi(i) axis to hinge axis
(deg) Angle of psi(i) axis to hinge axis
(deg) Percentage Progress
ASP-447
TRP-448
14.1
14.2
-47.8
29.4
67.0
62.6
40.0
TRP-448
GLN-449
11.6
11.6
-3.1
-16.2
65.8
59.9
167.0
GLN-449
VAL-450
12.3
12.6
-3.7
6.5
19.5
24.9
96.1

Graph shows rotational transition at bending residues and can be used
to identify hinge bending residues.
Probably only informative for interdomain rotations greater than 20 degrees
Residue
iResidue
i+1Distance of hinge axis to residue i in
(A) Distance of hinge axis to residue i in
(A) Change in
(deg) Change in
(deg) Angle of psi(i) axis to hinge axis
(deg) Angle of psi(i) axis to hinge axis
(deg) Percentage Progress
PRO-456
LEU-457
16.5
16.4
-4.9
8.9
124.9
127.1
83.2
LEU-457
MET-458
14.8
14.3
31.2
-21.1
11.6
23.4
146.2
MET-458
PRO-459
14.0
13.9
8.6
4.8
58.0
55.0
143.6

Graph shows rotational transition at bending residues and can be used
to identify hinge bending residues.
Probably only informative for interdomain rotations greater than 20 degrees
Residue
iResidue
i+1Distance of hinge axis to residue i in
(A) Distance of hinge axis to residue i in
(A) Change in
(deg) Change in
(deg) Angle of psi(i) axis to hinge axis
(deg) Angle of psi(i) axis to hinge axis
(deg) Percentage Progress
VAL-467
THR-468
8.7
9.0
17.3
-11.1
34.4
35.0
-53.4
THR-468
ILE-469
9.0
9.2
-0.1
1.0
134.4
132.0
122.9
ILE-469
THR-470
7.7
8.0
-3.6
4.1
149.8
154.3
20.1

Graph shows rotational transition at bending residues and can be used
to identify hinge bending residues.
Probably only informative for interdomain rotations greater than 20 degrees
Residue
iResidue
i+1Distance of hinge axis to residue i in
(A) Distance of hinge axis to residue i in
(A) Change in
(deg) Change in
(deg) Angle of psi(i) axis to hinge axis
(deg) Angle of psi(i) axis to hinge axis
(deg) Percentage Progress
PRO-477
GLY-478
8.7
8.8
9.5
-27.1
51.5
53.8
44.7
GLY-478
ARG-479
10.7
10.8
-14.0
-4.1
159.5
157.4
-216.3
ARG-479
TYR-480
10.7
10.8
-26.3
15.9
100.7
107.0
77.5

Graph shows rotational transition at bending residues and can be used
to identify hinge bending residues.
Probably only informative for interdomain rotations greater than 20 degrees
Residue
iResidue
i+1Distance of hinge axis to residue i in
(A) Distance of hinge axis to residue i in
(A) Change in
(deg) Change in
(deg) Angle of psi(i) axis to hinge axis
(deg) Angle of psi(i) axis to hinge axis
(deg) Percentage Progress
THR-500
VAL-501
6.7
6.7
-5.7
3.4
141.6
141.5
11.7
VAL-501
GLY-502
5.5
5.4
1.6
13.1
50.4
50.4
100.7
GLY-502
LEU-503
5.9
5.9
-4.9
-8.0
84.9
86.6
-62.7
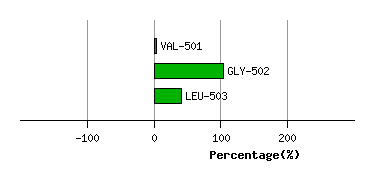
Graph shows rotational transition at bending residues and can be used
to identify hinge bending residues.
Probably only informative for interdomain rotations greater than 20 degrees