Pyruvate Kinase
(All numbering and residues are taken from first PDB file)
![]()
![]()
Bending Residue Dihedral Analysis
Residue
iResidue
i+1Distance of hinge axis to residue i in
(A) Distance of hinge axis to residue i in
(A) Change in
(deg) Change in
(deg) Angle of psi(i) axis to hinge axis
(deg) Angle of psi(i) axis to hinge axis
(deg) Percentage Progress
ALA-620
MET-621
13.2
13.0
11.2
-4.4
61.9
64.7
-194.3
MET-621
ALA-622
13.7
13.6
-12.8
17.1
131.9
133.5
219.9
ALA-622
ASP-623
10.5
10.4
-16.2
8.3
79.0
76.7
22.2
ASP-623
THR-624
8.7
9.2
2.1
7.1
103.0
102.3
-176.2
THR-624
PHE-625
4.9
5.4
5.6
-8.3
114.1
116.3
205.3
PHE-625
LEU-626
3.9
4.0
3.8
-9.0
130.6
130.0
163.3
PHE-625
LEU-626
3.9
4.0
3.8
-9.0
130.6
130.0
163.3
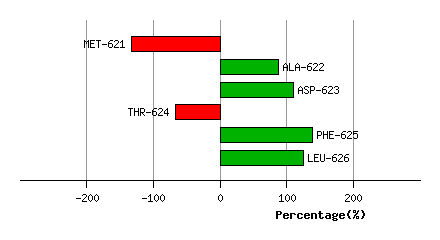
Graph shows rotational transition at bending residues and can be used
to identify hinge bending residues.
Probably only informative for interdomain rotations greater than 20 degrees
Residue
iResidue
i+1Distance of hinge axis to residue i in
(A) Distance of hinge axis to residue i in
(A) Change in
(deg) Change in
(deg) Angle of psi(i) axis to hinge axis
(deg) Angle of psi(i) axis to hinge axis
(deg) Percentage Progress
PHE-625
LEU-626
3.9
4.0
3.8
-9.0
130.6
130.0
163.3
PHE-625
LEU-626
3.9
4.0
3.8
-9.0
130.6
130.0
163.3
LEU-626
GLU-627
4.8
5.0
5.8
-7.0
102.9
100.2
-23.3
GLU-627
HIS-628
7.4
7.7
10.4
-8.3
45.0
38.0
118.0
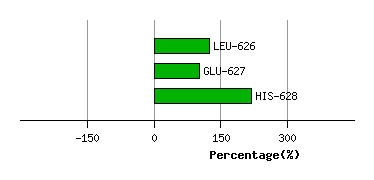
Graph shows rotational transition at bending residues and can be used
to identify hinge bending residues.
Probably only informative for interdomain rotations greater than 20 degrees
Residue
iResidue
i+1Distance of hinge axis to residue i in
(A) Distance of hinge axis to residue i in
(A) Change in
(deg) Change in
(deg) Angle of psi(i) axis to hinge axis
(deg) Angle of psi(i) axis to hinge axis
(deg) Percentage Progress
VAL-709
ALA-710
17.1
17.0
-1.9
8.2
95.5
93.9
24.1
ALA-710
LEU-711
15.9
16.1
-11.9
6.2
70.0
65.5
21.6
LEU-711
ASP-712
16.8
17.0
-10.3
17.4
126.8
128.0
82.4
ASP-712
THR-713
18.0
18.3
-12.9
6.6
66.0
65.1
300.7
THR-713
LYS-714
19.1
19.0
-16.5
-5.1
117.4
117.7
-382.4
LYS-714
GLY-715
22.5
22.4
1.9
-3.8
68.7
84.6
-114.4
GLY-715
PRO-716
21.4
21.6
-6.0
-2.6
82.1
87.6
255.8
PRO-716
GLU-717
23.9
24.1
-9.8
12.9
126.2
136.4
163.8
GLU-717
ILE-718
27.3
27.5
16.4
-6.9
96.6
94.0
16.6
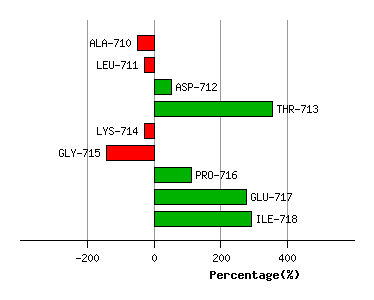
Graph shows rotational transition at bending residues and can be used
to identify hinge bending residues.
Probably only informative for interdomain rotations greater than 20 degrees
Residue
iResidue
i+1Distance of hinge axis to residue i in
(A) Distance of hinge axis to residue i in
(A) Change in
(deg) Change in
(deg) Angle of psi(i) axis to hinge axis
(deg) Angle of psi(i) axis to hinge axis
(deg) Percentage Progress
PRO-811
GLY-812
28.0
27.7
15.4
4.0
92.6
98.1
33.1
GLY-812
ALA-813
26.8
26.9
-7.9
-14.0
146.6
144.5
-662.2
ALA-813
ALA-814
27.9
27.6
20.7
-11.8
55.0
51.1
1001.9

Graph shows rotational transition at bending residues and can be used
to identify hinge bending residues.
Probably only informative for interdomain rotations greater than 20 degrees
Residue
iResidue
i+1Distance of hinge axis to residue i in
(A) Distance of hinge axis to residue i in
(A) Change in
(deg) Change in
(deg) Angle of psi(i) axis to hinge axis
(deg) Angle of psi(i) axis to hinge axis
(deg) Percentage Progress
LEU-817
PRO-818
25.6
25.4
-11.7
-2.4
69.9
66.1
286.9
PRO-818
ALA-819
22.6
22.7
-0.1
1.5
120.8
119.4
-125.8
ALA-819
VAL-820
19.2
19.2
2.4
-6.0
107.5
102.1
-288.8
VAL-820
SER-821
19.3
19.6
6.8
-12.0
119.9
117.4
192.1

Graph shows rotational transition at bending residues and can be used
to identify hinge bending residues.
Probably only informative for interdomain rotations greater than 20 degrees
Residue
iResidue
i+1Distance of hinge axis to residue i in
(A) Distance of hinge axis to residue i in
(A) Change in
(deg) Change in
(deg) Angle of psi(i) axis to hinge axis
(deg) Angle of psi(i) axis to hinge axis
(deg) Percentage Progress
ASP-837
MET-838
12.1
12.3
-3.8
-10.7
118.0
114.6
-146.9
MET-838
VAL-839
11.0
11.2
1.2
-2.4
99.0
90.9
270.9
VAL-839
PHE-840
12.4
12.5
-3.3
0.0
151.8
150.1
-146.7

Graph shows rotational transition at bending residues and can be used
to identify hinge bending residues.
Probably only informative for interdomain rotations greater than 20 degrees
Residue
iResidue
i+1Distance of hinge axis to residue i in
(A) Distance of hinge axis to residue i in
(A) Change in
(deg) Change in
(deg) Angle of psi(i) axis to hinge axis
(deg) Angle of psi(i) axis to hinge axis
(deg) Percentage Progress
VAL-850
HIS-851
12.0
12.1
4.0
2.4
21.3
24.0
39.0
HIS-851
GLU-852
11.8
11.7
-5.0
7.5
137.5
137.0
15.8
GLU-852
VAL-853
14.1
14.0
-8.5
0.5
101.0
99.3
158.1

Graph shows rotational transition at bending residues and can be used
to identify hinge bending residues.
Probably only informative for interdomain rotations greater than 20 degrees
Residue
iResidue
i+1Distance of hinge axis to residue i in
(A) Distance of hinge axis to residue i in
(A) Change in
(deg) Change in
(deg) Angle of psi(i) axis to hinge axis
(deg) Angle of psi(i) axis to hinge axis
(deg) Percentage Progress
LYS-862
ASN-863
3.4
3.6
1.0
3.4
43.1
40.2
390.6
ASN-863
ILE-864
4.8
5.0
-21.0
12.9
128.8
132.0
-104.9
ILE-864
LYS-865
7.1
7.5
-7.5
6.6
151.0
142.1
-183.0

Graph shows rotational transition at bending residues and can be used
to identify hinge bending residues.
Probably only informative for interdomain rotations greater than 20 degrees
Residue
iResidue
i+1Distance of hinge axis to residue i in
(A) Distance of hinge axis to residue i in
(A) Change in
(deg) Change in
(deg) Angle of psi(i) axis to hinge axis
(deg) Angle of psi(i) axis to hinge axis
(deg) Percentage Progress
GLU-874
GLY-875
20.6
20.3
-0.3
1.3
96.1
92.1
219.8
GLY-875
VAL-876
17.2
16.9
7.9
-8.2
147.9
141.4
-82.3
VAL-876
ARG-877
16.5
16.3
-18.0
12.4
85.6
84.8
-105.4
ARG-877
ARG-878
18.0
18.1
10.6
-15.6
47.4
48.4
1.8
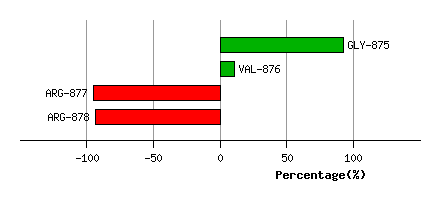
Graph shows rotational transition at bending residues and can be used
to identify hinge bending residues.
Probably only informative for interdomain rotations greater than 20 degrees
Residue
iResidue
i+1Distance of hinge axis to residue i in
(A) Distance of hinge axis to residue i in
(A) Change in
(deg) Change in
(deg) Angle of psi(i) axis to hinge axis
(deg) Angle of psi(i) axis to hinge axis
(deg) Percentage Progress
PHE-879
ASP-880
13.1
13.0
4.9
-1.9
73.4
71.4
-148.1
ASP-880
GLU-881
11.8
11.8
1.6
3.3
10.7
9.2
218.9
GLU-881
ILE-882
12.8
12.9
15.1
-20.5
63.2
57.7
-178.7
ILE-882
LEU-883
11.6
11.4
3.6
-7.4
85.1
86.3
-150.3
ILE-882
LEU-883
11.6
11.4
3.6
-7.4
85.1
86.3
-150.3

Graph shows rotational transition at bending residues and can be used
to identify hinge bending residues.
Probably only informative for interdomain rotations greater than 20 degrees
Residue
iResidue
i+1Distance of hinge axis to residue i in
(A) Distance of hinge axis to residue i in
(A) Change in
(deg) Change in
(deg) Angle of psi(i) axis to hinge axis
(deg) Angle of psi(i) axis to hinge axis
(deg) Percentage Progress
ILE-882
LEU-883
11.6
11.4
3.6
-7.4
85.1
86.3
-150.3
ILE-882
LEU-883
11.6
11.4
3.6
-7.4
85.1
86.3
-150.3
LEU-883
GLU-884
8.2
7.9
7.9
-6.0
129.8
127.5
-71.0
GLU-884
ALA-885
8.1
8.0
6.8
-16.0
160.7
161.3
316.9

Graph shows rotational transition at bending residues and can be used
to identify hinge bending residues.
Probably only informative for interdomain rotations greater than 20 degrees
Residue
iResidue
i+1Distance of hinge axis to residue i in
(A) Distance of hinge axis to residue i in
(A) Change in
(deg) Change in
(deg) Angle of psi(i) axis to hinge axis
(deg) Angle of psi(i) axis to hinge axis
(deg) Percentage Progress
MET-890
VAL-891
12.2
12.1
8.8
-12.5
127.8
132.6
-72.1
VAL-891
ALA-892
13.8
14.0
2.2
-8.7
84.3
83.1
154.2
ALA-892
ARG-893
17.5
17.5
-1.2
9.7
42.7
39.7
-130.5
ARG-893
GLY-894
19.2
19.0
-5.6
-6.9
97.2
100.6
-87.4
GLY-894
ASP-895
22.7
22.3
-6.8
8.6
95.4
106.8
244.5
ASP-895
LEU-896
23.3
22.9
9.3
-6.8
129.1
125.6
-7.5
LEU-896
GLY-897
20.9
20.9
0.4
12.1
147.4
141.7
-398.0
GLY-897
ILE-898
22.9
23.1
-4.2
1.5
99.6
98.0
185.8
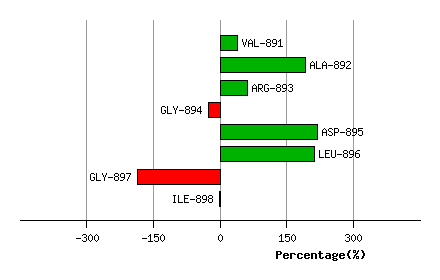
Graph shows rotational transition at bending residues and can be used
to identify hinge bending residues.
Probably only informative for interdomain rotations greater than 20 degrees
Residue
iResidue
i+1Distance of hinge axis to residue i in
(A) Distance of hinge axis to residue i in
(A) Change in
(deg) Change in
(deg) Angle of psi(i) axis to hinge axis
(deg) Angle of psi(i) axis to hinge axis
(deg) Percentage Progress
GLU-899
ILE-900
25.1
25.1
14.7
-6.5
148.2
147.2
-325.9
ILE-900
PRO-901
23.8
23.6
-3.9
-5.6
37.3
41.7
375.7
PRO-901
ALA-902
24.7
24.6
4.3
0.1
101.5
103.4
-174.2

Graph shows rotational transition at bending residues and can be used
to identify hinge bending residues.
Probably only informative for interdomain rotations greater than 20 degrees
Residue
iResidue
i+1Distance of hinge axis to residue i in
(A) Distance of hinge axis to residue i in
(A) Change in
(deg) Change in
(deg) Angle of psi(i) axis to hinge axis
(deg) Angle of psi(i) axis to hinge axis
(deg) Percentage Progress
ILE-913
GLY-914
6.7
6.7
-0.4
5.2
103.4
103.5
110.3
GLY-914
ARG-915
4.3
4.4
-9.0
20.2
42.1
40.5
-270.9
ARG-915
CYS-916
5.4
5.7
-14.3
4.9
38.2
42.2
308.0

Graph shows rotational transition at bending residues and can be used
to identify hinge bending residues.
Probably only informative for interdomain rotations greater than 20 degrees
Residue
iResidue
i+1Distance of hinge axis to residue i in
(A) Distance of hinge axis to residue i in
(A) Change in
(deg) Change in
(deg) Angle of psi(i) axis to hinge axis
(deg) Angle of psi(i) axis to hinge axis
(deg) Percentage Progress
ARG-918
ALA-919
2.9
2.8
3.0
-4.7
22.1
27.1
-240.5
ALA-919
GLY-920
3.2
3.4
4.1
0.2
62.9
55.0
194.3
GLY-920
LYS-921
2.0
2.0
-3.0
-5.8
141.2
138.2
-195.9

Graph shows rotational transition at bending residues and can be used
to identify hinge bending residues.
Probably only informative for interdomain rotations greater than 20 degrees
Residue
iResidue
i+1Distance of hinge axis to residue i in
(A) Distance of hinge axis to residue i in
(A) Change in
(deg) Change in
(deg) Angle of psi(i) axis to hinge axis
(deg) Angle of psi(i) axis to hinge axis
(deg) Percentage Progress
VAL-951
LEU-952
11.7
11.5
-8.4
8.4
126.0
127.3
-39.9
LEU-952
ASP-953
9.5
9.5
3.5
-14.5
106.5
105.0
477.2
ASP-953
GLY-954
7.6
7.7
20.7
-24.3
132.2
137.7
-102.4
GLY-954
ALA-955
6.4
6.7
22.5
-16.4
154.2
157.0
42.7
ALA-955
ASP-956
8.9
8.9
9.2
2.9
122.5
125.5
-491.9
ASP-956
CYS-957
9.2
9.1
-3.0
-13.6
77.7
79.7
38.9
CYS-957
ILE-958
12.6
12.4
-3.1
8.4
119.1
107.6
13.3

Graph shows rotational transition at bending residues and can be used
to identify hinge bending residues.
Probably only informative for interdomain rotations greater than 20 degrees
Residue
iResidue
i+1Distance of hinge axis to residue i in
(A) Distance of hinge axis to residue i in
(A) Change in
(deg) Change in
(deg) Angle of psi(i) axis to hinge axis
(deg) Angle of psi(i) axis to hinge axis
(deg) Percentage Progress
ALA-986
ALA-987
15.4
15.2
17.9
-16.5
45.9
35.6
70.1
ALA-987
MET-988
13.1
13.0
8.3
-5.7
103.8
100.1
221.6
MET-988
PHE-989
10.0
9.7
14.0
-19.0
55.6
58.4
43.1
PHE-989
HIS-990
8.1
8.2
13.2
-3.1
128.5
130.4
-223.8
HIS-990
ARG-991
9.4
9.6
-13.4
19.7
101.6
102.3
1.8

Graph shows rotational transition at bending residues and can be used
to identify hinge bending residues.
Probably only informative for interdomain rotations greater than 20 degrees
Residue
iResidue
i+1Distance of hinge axis to residue i in
(A) Distance of hinge axis to residue i in
(A) Change in
(deg) Change in
(deg) Angle of psi(i) axis to hinge axis
(deg) Angle of psi(i) axis to hinge axis
(deg) Percentage Progress
VAL-1029
LEU-1030
18.2
18.3
3.0
0.0
162.5
166.2
-4.8
LEU-1030
THR-1031
19.0
19.0
8.0
-8.6
114.0
112.9
119.7
THR-1031
GLU-1032
15.6
15.7
-3.7
6.5
35.6
40.3
184.2
GLU-1032
SER-1033
14.1
14.0
2.9
6.9
88.9
91.6
27.8
GLU-1032
SER-1033
14.1
14.0
2.9
6.9
88.9
91.6
27.8
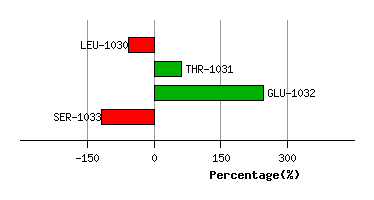
Graph shows rotational transition at bending residues and can be used
to identify hinge bending residues.
Probably only informative for interdomain rotations greater than 20 degrees
Residue
iResidue
i+1Distance of hinge axis to residue i in
(A) Distance of hinge axis to residue i in
(A) Change in
(deg) Change in
(deg) Angle of psi(i) axis to hinge axis
(deg) Angle of psi(i) axis to hinge axis
(deg) Percentage Progress
GLU-1032
SER-1033
14.1
14.0
2.9
6.9
88.9
91.6
27.8
GLU-1032
SER-1033
14.1
14.0
2.9
6.9
88.9
91.6
27.8
SER-1033
GLY-1034
10.6
10.3
-13.6
6.4
30.9
35.4
210.8
GLY-1034
ARG-1035
10.9
10.7
-16.6
14.7
51.5
47.7
-88.7

Graph shows rotational transition at bending residues and can be used
to identify hinge bending residues.
Probably only informative for interdomain rotations greater than 20 degrees
Residue
iResidue
i+1Distance of hinge axis to residue i in
(A) Distance of hinge axis to residue i in
(A) Change in
(deg) Change in
(deg) Angle of psi(i) axis to hinge axis
(deg) Angle of psi(i) axis to hinge axis
(deg) Percentage Progress
ASN-1055
HIS-1056
15.4
15.4
5.2
6.3
56.9
57.4
215.1
HIS-1056
GLN-1057
16.3
16.3
-19.1
19.0
110.9
116.4
2.8
GLN-1057
THR-1058
13.1
13.0
-0.5
-0.3
146.2
146.2
-337.0

Graph shows rotational transition at bending residues and can be used
to identify hinge bending residues.
Probably only informative for interdomain rotations greater than 20 degrees
Residue
iResidue
i+1Distance of hinge axis to residue i in
(A) Distance of hinge axis to residue i in
(A) Change in
(deg) Change in
(deg) Angle of psi(i) axis to hinge axis
(deg) Angle of psi(i) axis to hinge axis
(deg) Percentage Progress
VAL-1071
VAL-1072
20.8
20.8
7.4
-16.1
20.5
16.1
-233.1
VAL-1072
CYS-1073
21.0
21.0
-5.2
4.9
105.9
113.6
46.2
CYS-1073
LYS-1074
23.0
23.0
4.8
0.8
17.5
13.4
529.7
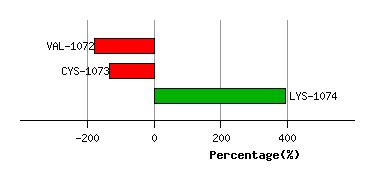
Graph shows rotational transition at bending residues and can be used
to identify hinge bending residues.
Probably only informative for interdomain rotations greater than 20 degrees