Atp Synthase Subunit Beta
(All numbering and residues are taken from first PDB file)
![]()
![]()
Bending Residue Dihedral Analysis
Residue
iResidue
i+1Distance of hinge axis to residue i in
(A) Distance of hinge axis to residue i in
(A) Change in
(deg) Change in
(deg) Angle of psi(i) axis to hinge axis
(deg) Angle of psi(i) axis to hinge axis
(deg) Percentage Progress
GLU-129
GLN-130
5.6
5.6
50.7
-2.1
49.0
43.2
150.6
GLN-130
GLU-131
3.7
4.0
27.6
-10.0
100.0
82.5
-0.7
GLU-131
ILE-132
6.8
6.7
52.8
-83.7
37.4
49.1
-87.7

Graph shows rotational transition at bending residues and can be used
to identify hinge bending residues.
Probably only informative for interdomain rotations greater than 20 degrees
Residue
iResidue
i+1Distance of hinge axis to residue i in
(A) Distance of hinge axis to residue i in
(A) Change in
(deg) Change in
(deg) Angle of psi(i) axis to hinge axis
(deg) Angle of psi(i) axis to hinge axis
(deg) Percentage Progress
GLY-149
GLY-150
5.9
5.3
-11.8
-2.3
87.2
80.7
6.2
GLY-150
LYS-151
2.2
2.1
-1.0
-9.7
22.7
14.3
36.0
LYS-151
ILE-152
1.9
2.2
5.7
-7.9
97.8
91.9
7.8
ILE-152
GLY-153
2.3
3.0
-13.5
41.4
34.2
31.9
-100.8

Graph shows rotational transition at bending residues and can be used
to identify hinge bending residues.
Probably only informative for interdomain rotations greater than 20 degrees
Residue
iResidue
i+1Distance of hinge axis to residue i in
(A) Distance of hinge axis to residue i in
(A) Change in
(deg) Change in
(deg) Angle of psi(i) axis to hinge axis
(deg) Angle of psi(i) axis to hinge axis
(deg) Percentage Progress
ILE-170
ASN-171
10.1
10.7
0.2
1.8
93.2
90.4
7.5
ASN-171
ASN-172
13.7
14.2
-10.3
22.0
157.3
154.8
22.1
ASN-172
VAL-173
14.3
15.0
-9.9
45.7
131.2
120.9
108.9

Graph shows rotational transition at bending residues and can be used
to identify hinge bending residues.
Probably only informative for interdomain rotations greater than 20 degrees
Residue
iResidue
i+1Distance of hinge axis to residue i in
(A) Distance of hinge axis to residue i in
(A) Change in
(deg) Change in
(deg) Angle of psi(i) axis to hinge axis
(deg) Angle of psi(i) axis to hinge axis
(deg) Percentage Progress
ALA-184
GLY-185
5.7
5.4
-0.1
-6.0
117.0
118.6
10.9
GLY-185
VAL-186
3.3
3.0
-14.9
35.3
103.0
108.6
27.5
VAL-186
GLY-187
4.9
5.2
-1.3
14.7
116.2
131.5
127.6
GLY-187
GLU-188
5.8
5.3
14.1
43.1
78.5
77.3
82.6
GLU-188
ARG-189
3.2
1.6
-69.6
2.9
151.4
158.7
-353.8
ARG-189
THR-190
2.3
1.7
-1.8
4.9
101.8
113.4
85.0
THR-190
ARG-191
1.5
1.5
0.1
-9.0
88.8
83.5
16.5
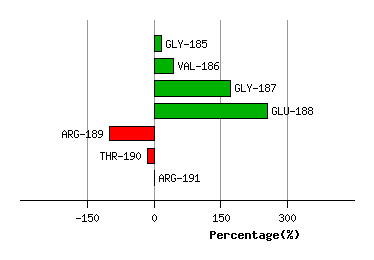
Graph shows rotational transition at bending residues and can be used
to identify hinge bending residues.
Probably only informative for interdomain rotations greater than 20 degrees
Residue
iResidue
i+1Distance of hinge axis to residue i in
(A) Distance of hinge axis to residue i in
(A) Change in
(deg) Change in
(deg) Angle of psi(i) axis to hinge axis
(deg) Angle of psi(i) axis to hinge axis
(deg) Percentage Progress
LEU-217
VAL-218
10.3
9.8
-2.2
6.6
109.7
110.0
21.2
VAL-218
TYR-219
9.3
9.0
-7.0
25.4
115.3
116.4
29.7
TYR-219
GLY-220
7.0
6.7
-14.6
42.6
122.4
107.6
50.4
GLY-220
GLN-221
7.2
7.2
1.7
17.0
84.7
56.9
41.6
GLN-221
MET-222
4.4
5.2
-34.8
20.3
118.2
104.0
-34.7
MET-222
ASN-223
5.9
6.0
-48.7
12.9
166.0
137.3
-137.6

Graph shows rotational transition at bending residues and can be used
to identify hinge bending residues.
Probably only informative for interdomain rotations greater than 20 degrees
Residue
iResidue
i+1Distance of hinge axis to residue i in
(A) Distance of hinge axis to residue i in
(A) Change in
(deg) Change in
(deg) Angle of psi(i) axis to hinge axis
(deg) Angle of psi(i) axis to hinge axis
(deg) Percentage Progress
PHE-254
ILE-255
3.7
3.3
-10.0
9.6
132.2
124.9
1.1
ILE-255
ASP-256
2.2
2.4
-15.2
6.1
115.2
113.4
29.2
ASP-256
ASN-257
1.2
1.7
-1.0
7.7
140.6
142.5
-33.9
ASN-257
ILE-258
4.2
4.6
18.1
-8.5
107.3
111.7
4.5
ILE-258
PHE-259
6.6
7.0
0.3
-2.3
75.8
70.9
12.9

Graph shows rotational transition at bending residues and can be used
to identify hinge bending residues.
Probably only informative for interdomain rotations greater than 20 degrees
Residue
iResidue
i+1Distance of hinge axis to residue i in
(A) Distance of hinge axis to residue i in
(A) Change in
(deg) Change in
(deg) Angle of psi(i) axis to hinge axis
(deg) Angle of psi(i) axis to hinge axis
(deg) Percentage Progress
HIS-328
LEU-329
9.0
8.8
-2.4
19.4
79.4
87.2
-0.4
LEU-329
ASP-330
6.0
6.3
-14.7
-5.0
21.8
23.0
72.6
ASP-330
ALA-331
4.1
4.5
11.6
-20.5
86.4
84.8
20.8

Graph shows rotational transition at bending residues and can be used
to identify hinge bending residues.
Probably only informative for interdomain rotations greater than 20 degrees