Chromosome Partition Protein Mukf
(All numbering and residues are taken from first PDB file)
![]()
![]()
Bending Residue Dihedral Analysis
Residue
iResidue
i+1Distance of hinge axis to residue i in
(A) Distance of hinge axis to residue i in
(A) Change in
(deg) Change in
(deg) Angle of psi(i) axis to hinge axis
(deg) Angle of psi(i) axis to hinge axis
(deg) Percentage Progress
SER-163
VAL-164
12.0
11.9
22.1
-1.5
40.4
43.5
144.9
VAL-164
ALA-165
9.4
9.4
-9.0
3.0
104.8
108.9
-32.1
ALA-165
GLU-166
6.9
7.0
3.3
-10.1
57.7
56.1
-47.3
GLU-166
ILE-167
10.1
10.3
4.7
-11.7
17.6
22.1
-13.1
ILE-167
PHE-168
10.4
10.8
25.1
-15.5
56.3
54.2
40.6
PHE-168
ASP-169
6.7
7.2
16.5
-24.8
77.2
70.9
1.6
ASP-169
SER-170
8.1
8.6
13.5
3.3
36.7
43.6
104.5
SER-170
ILE-171
10.7
11.3
-3.6
-9.7
152.1
151.4
-85.7
ILE-171
ASP-172
8.4
8.9
3.6
10.7
70.9
67.5
59.8
ASP-172
LEU-173
6.6
7.1
-5.8
-0.4
110.7
119.9
-0.3
LEU-173
THR-174
10.3
10.8
-3.1
20.4
159.3
155.3
129.2
THR-174
GLN-175
10.8
11.0
-29.7
14.9
130.5
134.4
-108.9
GLN-175
ARG-176
7.5
7.8
-10.3
10.5
103.5
109.2
-31.6

Graph shows rotational transition at bending residues and can be used
to identify hinge bending residues.
Probably only informative for interdomain rotations greater than 20 degrees
Residue
iResidue
i+1Distance of hinge axis to residue i in
(A) Distance of hinge axis to residue i in
(A) Change in
(deg) Change in
(deg) Angle of psi(i) axis to hinge axis
(deg) Angle of psi(i) axis to hinge axis
(deg) Percentage Progress
SER-212
GLY-213
5.5
5.7
-7.0
17.3
112.9
112.7
9.6
GLY-213
THR-214
8.6
9.0
-3.8
0.2
166.2
167.1
-17.3
THR-214
LEU-215
9.5
9.5
-3.8
7.0
126.9
127.6
18.0
LEU-215
ARG-216
5.9
5.9
9.6
-15.2
85.9
83.5
25.7
ARG-216
GLU-217
6.4
7.2
0.2
8.2
53.0
56.3
-2.1
GLU-217
LEU-218
9.8
10.5
1.6
11.6
9.5
17.0
111.7
LEU-218
GLN-219
8.6
8.5
-13.0
-10.2
111.6
117.2
-113.2
GLN-219
ASP-220
6.3
7.0
11.0
2.1
88.0
85.2
33.6
ASP-220
THR-221
9.7
10.6
-10.6
-10.5
144.1
146.3
-124.3
THR-221
LEU-222
11.3
12.0
13.9
-0.1
35.0
31.1
86.5
LEU-222
GLU-223
8.5
9.0
-11.8
10.8
94.4
104.2
15.2
GLU-223
ALA-224
9.5
9.6
-16.5
8.2
102.9
110.3
-43.4
ALA-224
ALA-225
13.0
13.3
-31.0
36.9
169.1
166.2
26.6
ALA-225
GLY-226
12.5
12.9
-7.8
10.7
124.5
123.9
35.0
GLY-226
ASP-227
10.0
10.0
-2.2
4.3
118.4
119.6
54.7
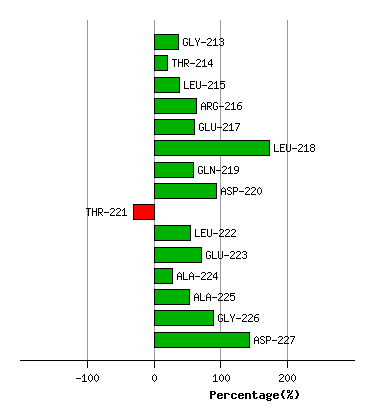
Graph shows rotational transition at bending residues and can be used
to identify hinge bending residues.
Probably only informative for interdomain rotations greater than 20 degrees
Residue
iResidue
i+1Distance of hinge axis to residue i in
(A) Distance of hinge axis to residue i in
(A) Change in
(deg) Change in
(deg) Angle of psi(i) axis to hinge axis
(deg) Angle of psi(i) axis to hinge axis
(deg) Percentage Progress
ILE-263
ILE-264
0.8
1.3
-6.9
3.2
141.9
142.0
-27.4
ILE-264
SER-265
3.3
3.2
-3.8
7.6
122.7
128.3
12.6
SER-265
TRP-266
3.9
3.4
3.7
-3.0
55.7
53.9
15.1
TRP-266
GLY-267
2.6
1.9
2.0
-1.7
42.7
45.9
6.5
GLY-267
GLN-268
0.7
1.6
-10.6
7.3
147.0
145.4
-11.7
GLN-268
GLN-269
2.9
2.9
-3.0
3.2
113.3
115.2
-19.4
GLN-269
SER-270
4.3
3.4
-5.8
-3.9
129.6
134.8
-55.1
SER-270
ILE-271
3.2
2.5
8.3
-1.8
26.8
30.8
40.2
ILE-271
ASP-272
0.6
0.4
9.6
-14.9
55.3
54.4
-41.9
ASP-272
LEU-273
4.3
3.4
5.0
-15.1
66.6
62.3
-43.0
LEU-273
TRP-274
5.8
5.0
19.4
5.9
41.5
50.7
117.4
TRP-274
ILE-275
4.1
3.5
15.3
-13.8
31.6
29.2
12.2
ILE-275
GLY-276
2.5
2.4
-1.0
4.0
112.6
112.1
17.2

Graph shows rotational transition at bending residues and can be used
to identify hinge bending residues.
Probably only informative for interdomain rotations greater than 20 degrees