DNA Mismatch Repair Protein Muts
(All numbering and residues are taken from first PDB file)
![]()
![]()
Bending Residue Dihedral Analysis
Residue
iResidue
i+1Distance of hinge axis to residue i in
(A) Distance of hinge axis to residue i in
(A) Change in
(deg) Change in
(deg) Angle of psi(i) axis to hinge axis
(deg) Angle of psi(i) axis to hinge axis
(deg) Percentage Progress
TYR-404
ASP-405
8.4
9.0
-21.5
1.5
60.6
70.8
95.2
ASP-405
PRO-406
7.7
8.0
4.4
-4.5
119.1
129.4
6.8
PRO-406
ASP-407
4.5
4.5
1.5
5.6
172.2
163.5
-64.1
ASP-407
LEU-408
6.3
6.2
-22.2
32.4
62.1
60.2
-80.7
LEU-408
ASP-409
7.3
8.2
-21.0
20.1
92.6
85.1
-6.5
ASP-409
ALA-410
5.4
6.4
-15.0
10.7
42.6
41.3
61.5
ASP-409
ALA-410
5.4
6.4
-15.0
10.7
42.6
41.3
61.5

Graph shows rotational transition at bending residues and can be used
to identify hinge bending residues.
Probably only informative for interdomain rotations greater than 20 degrees
Residue
iResidue
i+1Distance of hinge axis to residue i in
(A) Distance of hinge axis to residue i in
(A) Change in
(deg) Change in
(deg) Angle of psi(i) axis to hinge axis
(deg) Angle of psi(i) axis to hinge axis
(deg) Percentage Progress
ASP-409
ALA-410
5.4
6.4
-15.0
10.7
42.6
41.3
61.5
ASP-409
ALA-410
5.4
6.4
-15.0
10.7
42.6
41.3
61.5
ALA-410
LEU-411
2.7
3.5
-16.1
9.5
30.7
25.7
45.4
LEU-411
ARG-412
5.4
5.8
0.0
9.0
95.8
98.5
41.1

Graph shows rotational transition at bending residues and can be used
to identify hinge bending residues.
Probably only informative for interdomain rotations greater than 20 degrees
Residue
iResidue
i+1Distance of hinge axis to residue i in
(A) Distance of hinge axis to residue i in
(A) Change in
(deg) Change in
(deg) Angle of psi(i) axis to hinge axis
(deg) Angle of psi(i) axis to hinge axis
(deg) Percentage Progress
ARG-416
GLU-417
10.1
10.6
5.6
3.2
51.5
56.9
20.1
GLU-417
GLY-418
9.2
9.4
-2.6
8.4
161.7
161.3
58.0
GLY-418
VAL-419
8.2
9.1
-19.1
22.8
109.8
101.5
-7.8
VAL-419
ALA-420
11.8
12.8
5.6
-8.9
96.2
94.0
3.9
VAL-419
ALA-420
11.8
12.8
5.6
-8.9
96.2
94.0
3.9
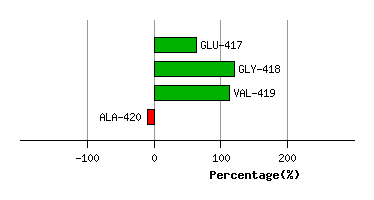
Graph shows rotational transition at bending residues and can be used
to identify hinge bending residues.
Probably only informative for interdomain rotations greater than 20 degrees
Residue
iResidue
i+1Distance of hinge axis to residue i in
(A) Distance of hinge axis to residue i in
(A) Change in
(deg) Change in
(deg) Angle of psi(i) axis to hinge axis
(deg) Angle of psi(i) axis to hinge axis
(deg) Percentage Progress
VAL-419
ALA-420
11.8
12.8
5.6
-8.9
96.2
94.0
3.9
VAL-419
ALA-420
11.8
12.8
5.6
-8.9
96.2
94.0
3.9
ALA-420
TYR-421
13.4
13.7
-13.9
-7.8
28.1
25.0
193.6
TYR-421
PHE-422
11.9
12.2
19.3
-25.9
130.3
131.9
20.7

Graph shows rotational transition at bending residues and can be used
to identify hinge bending residues.
Probably only informative for interdomain rotations greater than 20 degrees
Residue
iResidue
i+1Distance of hinge axis to residue i in
(A) Distance of hinge axis to residue i in
(A) Change in
(deg) Change in
(deg) Angle of psi(i) axis to hinge axis
(deg) Angle of psi(i) axis to hinge axis
(deg) Percentage Progress
LYS-482
GLU-483
6.9
6.4
-7.3
20.8
47.7
35.7
-74.4
GLU-483
LYS-484
4.0
3.5
5.3
-4.5
158.9
147.0
-12.0
LYS-484
GLU-485
5.9
6.0
24.8
-33.8
102.0
96.3
-32.5

Graph shows rotational transition at bending residues and can be used
to identify hinge bending residues.
Probably only informative for interdomain rotations greater than 20 degrees