Capsid Protein
(All numbering and residues are taken from first PDB file)
![]()
![]()
Bending Residue Dihedral Analysis
Residue
iResidue
i+1Distance of hinge axis to residue i in
(A) Distance of hinge axis to residue i in
(A) Change in
(deg) Change in
(deg) Angle of psi(i) axis to hinge axis
(deg) Angle of psi(i) axis to hinge axis
(deg) Percentage Progress
MET-1033
ASP-1034
16.5
16.4
-10.4
10.9
52.7
55.1
-48.6
ASP-1034
PRO-1035
18.0
17.5
8.6
-12.7
117.8
112.6
1.4
PRO-1035
VAL-1036
16.3
15.8
13.0
-11.0
142.6
150.4
-10.0
VAL-1036
ALA-1037
13.7
13.4
9.9
-10.2
135.6
129.4
23.7
ALA-1037
GLY-1038
13.6
13.4
-3.6
4.8
81.3
80.7
-4.8
GLY-1038
SER-1039
11.2
11.0
1.5
-6.0
162.4
165.0
38.0
SER-1039
SER-1040
10.3
10.4
-4.2
9.0
49.0
44.8
-38.5
SER-1040
THR-1041
13.0
13.1
-9.2
13.9
69.6
59.1
-32.4
THR-1041
ALA-1042
11.1
11.1
-4.4
15.3
43.7
41.5
-54.1
ALA-1042
VAL-1043
7.8
8.0
-49.9
38.1
41.0
38.8
72.9
VAL-1043
ALA-1044
9.6
10.3
5.9
3.5
155.3
160.6
-66.1
ALA-1044
THR-1045
9.4
10.2
-37.6
15.0
85.2
67.8
72.4

Graph shows rotational transition at bending residues and can be used
to identify hinge bending residues.
Probably only informative for interdomain rotations greater than 20 degrees
Residue
iResidue
i+1Distance of hinge axis to residue i in
(A) Distance of hinge axis to residue i in
(A) Change in
(deg) Change in
(deg) Angle of psi(i) axis to hinge axis
(deg) Angle of psi(i) axis to hinge axis
(deg) Percentage Progress
ILE-1070
SER-1071
4.5
4.7
3.8
-0.5
154.3
153.2
-0.4
SER-1071
PRO-1072
6.1
6.2
0.5
-5.4
118.5
121.2
20.1
PRO-1072
ASN-1073
6.1
6.1
2.1
-6.9
74.0
78.6
-19.7

Graph shows rotational transition at bending residues and can be used
to identify hinge bending residues.
Probably only informative for interdomain rotations greater than 20 degrees
Residue
iResidue
i+1Distance of hinge axis to residue i in
(A) Distance of hinge axis to residue i in
(A) Change in
(deg) Change in
(deg) Angle of psi(i) axis to hinge axis
(deg) Angle of psi(i) axis to hinge axis
(deg) Percentage Progress
SER-1084
LEU-1085
2.6
3.0
2.0
-3.1
129.3
127.8
17.9
LEU-1085
GLY-1086
1.1
0.9
-7.7
3.8
39.4
41.1
37.7
GLY-1086
PRO-1087
1.9
2.1
5.1
0.7
83.6
81.6
26.9

Graph shows rotational transition at bending residues and can be used
to identify hinge bending residues.
Probably only informative for interdomain rotations greater than 20 degrees
Residue
iResidue
i+1Distance of hinge axis to residue i in
(A) Distance of hinge axis to residue i in
(A) Change in
(deg) Change in
(deg) Angle of psi(i) axis to hinge axis
(deg) Angle of psi(i) axis to hinge axis
(deg) Percentage Progress
VAL-1109
ARG-1110
7.9
7.5
-4.4
2.7
33.5
29.1
48.4
ARG-1110
ILE-1111
9.5
9.0
-14.1
19.9
48.9
48.5
0.5
ILE-1111
MET-1112
7.7
6.9
-4.7
14.4
32.8
38.1
-87.9
MET-1112
LEU-1113
9.3
8.9
-11.8
-10.3
43.8
30.9
165.6
LEU-1113
ALA-1114
8.1
8.1
41.0
-91.6
133.5
126.6
397.7
ALA-1114
GLY-1115
10.3
10.3
-33.5
35.9
29.5
32.0
-15.4
GLY-1115
ASN-1116
8.5
8.5
-14.3
62.4
37.3
36.2
-398.7
ASN-1116
ALA-1117
9.5
9.8
-34.6
30.9
65.9
72.5
-53.9
ALA-1117
PHE-1118
9.6
10.3
-4.7
5.8
60.1
54.1
-18.8
PHE-1118
THR-1119
6.4
7.3
-1.4
6.8
128.4
118.3
-8.8
THR-1119
ALA-1120
4.5
4.7
41.6
-30.9
76.1
73.8
40.4

Graph shows rotational transition at bending residues and can be used
to identify hinge bending residues.
Probably only informative for interdomain rotations greater than 20 degrees
Residue
iResidue
i+1Distance of hinge axis to residue i in
(A) Distance of hinge axis to residue i in
(A) Change in
(deg) Change in
(deg) Angle of psi(i) axis to hinge axis
(deg) Angle of psi(i) axis to hinge axis
(deg) Percentage Progress
GLY-1121
LYS-1122
4.2
3.8
-12.4
3.1
37.6
30.9
85.4
LYS-1122
ILE-1123
6.0
5.5
5.5
3.0
140.2
136.9
-80.4
ILE-1123
ILE-1124
4.8
4.5
12.0
-15.2
134.1
129.2
91.6
ILE-1124
VAL-1125
6.9
6.8
0.8
2.5
28.6
24.7
75.6
ILE-1124
VAL-1125
6.9
6.8
0.8
2.5
28.6
24.7
75.6

Graph shows rotational transition at bending residues and can be used
to identify hinge bending residues.
Probably only informative for interdomain rotations greater than 20 degrees
Residue
iResidue
i+1Distance of hinge axis to residue i in
(A) Distance of hinge axis to residue i in
(A) Change in
(deg) Change in
(deg) Angle of psi(i) axis to hinge axis
(deg) Angle of psi(i) axis to hinge axis
(deg) Percentage Progress
ILE-1124
VAL-1125
6.9
6.8
0.8
2.5
28.6
24.7
75.6
ILE-1124
VAL-1125
6.9
6.8
0.8
2.5
28.6
24.7
75.6
VAL-1125
SER-1126
6.0
6.1
10.0
-6.4
53.1
56.0
-2.4
SER-1126
CYS-1127
8.2
8.5
-0.8
-0.6
161.9
161.4
-12.7

Graph shows rotational transition at bending residues and can be used
to identify hinge bending residues.
Probably only informative for interdomain rotations greater than 20 degrees
Residue
iResidue
i+1Distance of hinge axis to residue i in
(A) Distance of hinge axis to residue i in
(A) Change in
(deg) Change in
(deg) Angle of psi(i) axis to hinge axis
(deg) Angle of psi(i) axis to hinge axis
(deg) Percentage Progress
LEU-1155
ASP-1156
14.0
13.7
-37.1
18.8
9.7
3.6
183.4
ASP-1156
PRO-1157
14.6
14.5
-25.6
22.7
57.3
61.9
-21.4
PRO-1157
ILE-1158
12.3
11.7
-27.4
35.3
75.5
64.4
-21.7
ILE-1158
GLU-1159
10.8
10.4
-3.9
7.4
3.8
8.7
-26.2

Graph shows rotational transition at bending residues and can be used
to identify hinge bending residues.
Probably only informative for interdomain rotations greater than 20 degrees
Residue
iResidue
i+1Distance of hinge axis to residue i in
(A) Distance of hinge axis to residue i in
(A) Change in
(deg) Change in
(deg) Angle of psi(i) axis to hinge axis
(deg) Angle of psi(i) axis to hinge axis
(deg) Percentage Progress
HIS-1171
ASN-1172
2.4
2.4
9.5
-13.1
61.6
58.5
-23.0
ASN-1172
ASN-1173
3.0
3.2
5.1
-22.2
137.6
136.0
150.6
ASN-1173
ASP-1174
5.5
6.0
-35.9
35.9
81.2
90.4
56.7
ASP-1174
ARG-1175
7.4
8.6
66.0
-4.9
161.1
147.9
-563.1
ARG-1175
ASN-1176
7.9
10.7
-19.6
22.7
78.3
96.3
68.8
ASN-1176
GLN-1177
10.2
10.7
0.8
-20.6
83.5
115.0
71.0
GLN-1177
GLN-1178
7.8
7.7
-10.8
-29.1
25.9
12.2
324.1
GLN-1178
THR-1179
8.4
8.2
5.6
9.5
91.5
101.8
-26.2
THR-1179
MET-1180
5.7
5.6
5.1
-9.3
158.0
155.4
29.1
MET-1180
ARG-1181
6.3
6.3
7.8
2.2
133.0
135.9
-66.2

Graph shows rotational transition at bending residues and can be used
to identify hinge bending residues.
Probably only informative for interdomain rotations greater than 20 degrees
Residue
iResidue
i+1Distance of hinge axis to residue i in
(A) Distance of hinge axis to residue i in
(A) Change in
(deg) Change in
(deg) Angle of psi(i) axis to hinge axis
(deg) Angle of psi(i) axis to hinge axis
(deg) Percentage Progress
PHE-1200
VAL-1201
9.9
9.7
-6.8
-7.3
43.4
52.0
179.6
VAL-1201
VAL-1202
8.4
8.0
5.4
1.5
112.3
120.6
9.1
VAL-1202
ALA-1203
6.9
6.8
-0.5
-7.0
20.9
24.8
46.8
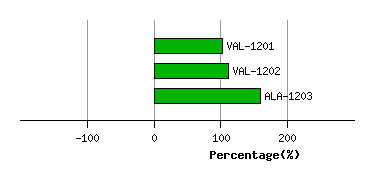
Graph shows rotational transition at bending residues and can be used
to identify hinge bending residues.
Probably only informative for interdomain rotations greater than 20 degrees