Putative Enzyme Ydif
(All numbering and residues are taken from first PDB file)
![]()
![]()
Bending Residue Dihedral Analysis
Residue
iResidue
i+1Distance of hinge axis to residue i in
(A) Distance of hinge axis to residue i in
(A) Change in
(deg) Change in
(deg) Angle of psi(i) axis to hinge axis
(deg) Angle of psi(i) axis to hinge axis
(deg) Percentage Progress
LEU-275
ASP-276
19.4
19.2
3.8
-0.7
77.1
73.5
-31.4
PRO-284
LEU-285
23.2
23.6
26.9
1.5
144.2
129.8
-691.2
LEU-285
ASN-286
21.9
21.9
-20.8
31.3
23.7
25.1
-280.1
ASN-286
GLN-287
21.7
21.9
8.8
-6.3
118.1
120.8
140.9
GLN-287
ARG-288
19.2
19.5
-8.8
6.8
115.4
116.9
-31.8
ARG-288
LYS-289
17.7
17.9
-1.1
0.6
140.7
134.0
-20.5
LYS-289
LEU-290
17.1
17.2
0.1
-0.9
109.2
113.1
111.4
LEU-290
VAL-291
15.9
16.1
-5.1
4.1
77.0
76.5
13.6

Graph shows rotational transition at bending residues and can be used
to identify hinge bending residues.
Probably only informative for interdomain rotations greater than 20 degrees
Residue
iResidue
i+1Distance of hinge axis to residue i in
(A) Distance of hinge axis to residue i in
(A) Change in
(deg) Change in
(deg) Angle of psi(i) axis to hinge axis
(deg) Angle of psi(i) axis to hinge axis
(deg) Percentage Progress
ARG-293
ARG-294
12.0
12.1
1.8
-0.9
118.7
118.4
-35.8
ARG-294
ALA-295
10.0
10.1
-3.5
-0.3
95.3
96.5
12.4
ALA-295
LEU-296
7.6
7.6
1.9
3.6
30.6
29.4
74.4

Graph shows rotational transition at bending residues and can be used
to identify hinge bending residues.
Probably only informative for interdomain rotations greater than 20 degrees
Residue
iResidue
i+1Distance of hinge axis to residue i in
(A) Distance of hinge axis to residue i in
(A) Change in
(deg) Change in
(deg) Angle of psi(i) axis to hinge axis
(deg) Angle of psi(i) axis to hinge axis
(deg) Percentage Progress
ARG-300
LYS-301
1.8
1.9
-2.9
-1.8
23.7
21.3
286.1
LYS-301
GLY-302
1.9
2.2
-4.5
13.0
86.7
86.7
-93.8
GLY-302
ALA-303
3.5
3.6
-12.1
19.5
141.9
138.9
374.6

Graph shows rotational transition at bending residues and can be used
to identify hinge bending residues.
Probably only informative for interdomain rotations greater than 20 degrees
Residue
iResidue
i+1Distance of hinge axis to residue i in
(A) Distance of hinge axis to residue i in
(A) Change in
(deg) Change in
(deg) Angle of psi(i) axis to hinge axis
(deg) Angle of psi(i) axis to hinge axis
(deg) Percentage Progress
GLY-305
ASN-306
7.8
7.7
-9.3
7.0
86.7
84.5
-179.0
ASN-306
VAL-307
10.8
10.7
17.5
-27.7
122.8
123.6
19.9
VAL-307
GLY-308
11.7
11.8
-14.5
10.3
67.3
67.6
428.5
GLY-308
VAL-309
14.4
14.5
6.4
-4.4
87.9
89.0
82.7
GLY-308
VAL-309
14.4
14.5
6.4
-4.4
87.9
89.0
82.7

Graph shows rotational transition at bending residues and can be used
to identify hinge bending residues.
Probably only informative for interdomain rotations greater than 20 degrees
Residue
iResidue
i+1Distance of hinge axis to residue i in
(A) Distance of hinge axis to residue i in
(A) Change in
(deg) Change in
(deg) Angle of psi(i) axis to hinge axis
(deg) Angle of psi(i) axis to hinge axis
(deg) Percentage Progress
GLY-308
VAL-309
14.4
14.5
6.4
-4.4
87.9
89.0
82.7
GLY-308
VAL-309
14.4
14.5
6.4
-4.4
87.9
89.0
82.7
VAL-309
GLY-310
17.6
17.5
2.5
10.9
38.1
39.5
447.7
GLY-310
ILE-311
17.3
17.2
-1.8
12.2
71.2
72.8
-61.6
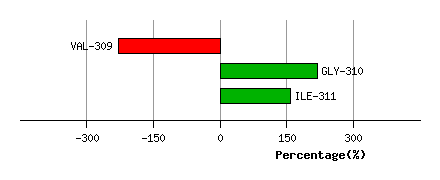
Graph shows rotational transition at bending residues and can be used
to identify hinge bending residues.
Probably only informative for interdomain rotations greater than 20 degrees
Residue
iResidue
i+1Distance of hinge axis to residue i in
(A) Distance of hinge axis to residue i in
(A) Change in
(deg) Change in
(deg) Angle of psi(i) axis to hinge axis
(deg) Angle of psi(i) axis to hinge axis
(deg) Percentage Progress
LEU-371
ASP-372
10.1
10.1
3.0
3.1
106.7
107.9
9.8
ASP-372
VAL-373
6.9
7.0
6.8
-16.9
130.3
133.1
289.5
VAL-373
CYS-374
5.3
5.4
6.7
-6.2
99.9
95.1
-138.4

Graph shows rotational transition at bending residues and can be used
to identify hinge bending residues.
Probably only informative for interdomain rotations greater than 20 degrees
Residue
iResidue
i+1Distance of hinge axis to residue i in
(A) Distance of hinge axis to residue i in
(A) Change in
(deg) Change in
(deg) Angle of psi(i) axis to hinge axis
(deg) Angle of psi(i) axis to hinge axis
(deg) Percentage Progress
LEU-376
SER-377
11.3
11.3
-1.2
-1.2
127.2
131.1
-102.2
SER-377
PHE-378
13.3
13.3
-6.1
9.5
156.8
152.4
218.9
PHE-378
ALA-379
13.2
13.2
2.9
5.3
59.0
59.4
293.8
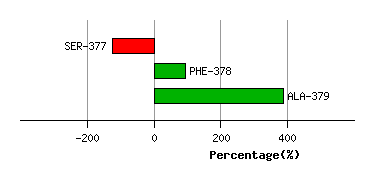
Graph shows rotational transition at bending residues and can be used
to identify hinge bending residues.
Probably only informative for interdomain rotations greater than 20 degrees
Residue
iResidue
i+1Distance of hinge axis to residue i in
(A) Distance of hinge axis to residue i in
(A) Change in
(deg) Change in
(deg) Angle of psi(i) axis to hinge axis
(deg) Angle of psi(i) axis to hinge axis
(deg) Percentage Progress
LYS-411
ILE-412
4.8
4.6
-3.4
1.4
77.1
76.3
34.7
ILE-412
ILE-413
5.5
5.4
3.2
-0.2
106.2
105.3
-17.8
ILE-413
PHE-414
5.1
5.0
-0.3
-2.9
68.7
66.9
-41.9
PHE-414
CYS-415
7.8
7.7
-0.6
1.7
82.3
84.7
-91.4
PHE-414
CYS-415
7.8
7.7
-0.6
1.7
82.3
84.7
-91.4

Graph shows rotational transition at bending residues and can be used
to identify hinge bending residues.
Probably only informative for interdomain rotations greater than 20 degrees
Residue
iResidue
i+1Distance of hinge axis to residue i in
(A) Distance of hinge axis to residue i in
(A) Change in
(deg) Change in
(deg) Angle of psi(i) axis to hinge axis
(deg) Angle of psi(i) axis to hinge axis
(deg) Percentage Progress
PHE-414
CYS-415
7.8
7.7
-0.6
1.7
82.3
84.7
-91.4
PHE-414
CYS-415
7.8
7.7
-0.6
1.7
82.3
84.7
-91.4
CYS-415
GLY-416
10.4
10.3
2.8
5.5
60.3
58.9
231.5
GLY-416
THR-417
13.4
13.3
16.2
-22.5
64.0
67.0
-150.6
THR-417
LEU-418
15.3
15.1
-1.0
6.3
157.2
159.6
193.1
LEU-418
THR-419
14.1
14.1
-8.2
-4.0
135.2
130.6
-502.2
THR-419
ALA-420
17.2
17.3
3.8
-19.0
124.5
126.0
366.1
ALA-420
GLY-421
19.8
20.1
-15.7
7.6
119.8
121.6
-315.3
GLY-421
SER-422
23.5
23.9
5.3
17.7
105.4
97.5
-212.3
SER-422
LEU-423
25.7
26.0
-20.2
7.5
94.3
86.6
33.3
LEU-423
LYS-424
23.4
23.3
-12.5
4.4
35.2
35.0
326.9
LYS-424
THR-425
25.4
25.3
-1.2
0.1
83.2
79.7
-446.0

Graph shows rotational transition at bending residues and can be used
to identify hinge bending residues.
Probably only informative for interdomain rotations greater than 20 degrees
Residue
iResidue
i+1Distance of hinge axis to residue i in
(A) Distance of hinge axis to residue i in
(A) Change in
(deg) Change in
(deg) Angle of psi(i) axis to hinge axis
(deg) Angle of psi(i) axis to hinge axis
(deg) Percentage Progress
ILE-444
ARG-445
10.7
10.7
0.7
2.6
65.8
65.3
3.2
ARG-445
GLU-446
8.4
8.5
1.3
-8.9
107.1
108.1
-30.8
GLU-446
LEU-447
10.2
10.2
-2.1
-7.5
59.1
60.8
203.6

Graph shows rotational transition at bending residues and can be used
to identify hinge bending residues.
Probably only informative for interdomain rotations greater than 20 degrees
Residue
iResidue
i+1Distance of hinge axis to residue i in
(A) Distance of hinge axis to residue i in
(A) Change in
(deg) Change in
(deg) Angle of psi(i) axis to hinge axis
(deg) Angle of psi(i) axis to hinge axis
(deg) Percentage Progress
ARG-465
TYR-466
2.2
2.1
0.0
0.1
71.3
71.4
-14.5
TYR-466
ILE-467
5.6
5.6
11.2
-10.5
73.3
73.8
86.1
ILE-467
THR-468
8.3
8.4
-1.3
0.2
70.7
70.9
37.4

Graph shows rotational transition at bending residues and can be used
to identify hinge bending residues.
Probably only informative for interdomain rotations greater than 20 degrees
Residue
iResidue
i+1Distance of hinge axis to residue i in
(A) Distance of hinge axis to residue i in
(A) Change in
(deg) Change in
(deg) Angle of psi(i) axis to hinge axis
(deg) Angle of psi(i) axis to hinge axis
(deg) Percentage Progress
PHE-517
ILE-518
19.8
20.1
-2.6
11.3
51.8
49.8
-114.1
ILE-518
ASP-519
21.9
22.0
-1.4
-1.0
45.7
49.6
171.5
ASP-519
ALA-520
23.0
23.0
4.7
-5.9
164.6
165.2
81.1
ALA-520
ALA-521
21.7
21.6
4.3
3.3
94.3
95.6
-39.0
GLY-523
PHE-524
15.3
15.2
-1.3
-13.2
113.4
111.4
-247.4
GLY-523
PHE-524
15.3
15.2
-1.3
-13.2
113.4
111.4
-247.4

Graph shows rotational transition at bending residues and can be used
to identify hinge bending residues.
Probably only informative for interdomain rotations greater than 20 degrees
Residue
iResidue
i+1Distance of hinge axis to residue i in
(A) Distance of hinge axis to residue i in
(A) Change in
(deg) Change in
(deg) Angle of psi(i) axis to hinge axis
(deg) Angle of psi(i) axis to hinge axis
(deg) Percentage Progress
GLY-523
PHE-524
15.3
15.2
-1.3
-13.2
113.4
111.4
-247.4
GLY-523
PHE-524
15.3
15.2
-1.3
-13.2
113.4
111.4
-247.4
PHE-524
VAL-525
12.0
11.9
-0.1
1.7
44.5
46.8
9.5
VAL-525
LEU-526
9.9
9.5
8.0
4.3
64.9
56.0
514.3
LEU-526
PRO-527
6.2
5.9
1.4
4.7
90.1
91.0
-192.6
PRO-527
GLU-528
6.7
6.9
3.5
-3.5
108.2
107.3
-83.1

Graph shows rotational transition at bending residues and can be used
to identify hinge bending residues.
Probably only informative for interdomain rotations greater than 20 degrees