5-Methyltetrahydropteroyltriglutamate--Homocysteine Methyltransferase
(All numbering and residues are taken from first PDB file)
![]()
![]()
Bending Residue Dihedral Analysis
Residue
iResidue
i+1Distance of hinge axis to residue i in
(A) Distance of hinge axis to residue i in
(A) Change in
(deg) Change in
(deg) Angle of psi(i) axis to hinge axis
(deg) Angle of psi(i) axis to hinge axis
(deg) Percentage Progress
SER-400
ILE-401
14.6
14.0
4.4
-2.9
96.8
102.9
3.2
ILE-401
THR-402
11.2
10.9
14.6
-19.5
147.7
164.9
123.1
THR-402
ASN-403
10.9
11.5
8.7
-9.9
101.3
101.5
28.4
ASN-403
ASP-404
11.6
12.7
-29.0
18.1
133.7
137.8
-51.6
ASP-404
PRO-405
10.9
11.8
20.7
-13.5
117.7
116.2
-11.4
PRO-405
LYS-406
13.9
14.9
9.6
-4.7
89.6
92.8
-61.6

Graph shows rotational transition at bending residues and can be used
to identify hinge bending residues.
Probably only informative for interdomain rotations greater than 20 degrees
Residue
iResidue
i+1Distance of hinge axis to residue i in
(A) Distance of hinge axis to residue i in
(A) Change in
(deg) Change in
(deg) Angle of psi(i) axis to hinge axis
(deg) Angle of psi(i) axis to hinge axis
(deg) Percentage Progress
VAL-407
GLN-408
10.6
11.1
12.6
-1.8
149.1
146.9
-81.4
GLN-408
GLU-409
12.4
13.4
2.6
-10.4
106.0
101.5
64.7
GLU-409
ARG-410
15.4
16.2
18.4
-16.4
104.9
110.9
-35.7
ARG-410
LEU-411
14.0
14.2
-10.9
-3.0
22.4
15.0
99.4
LEU-411
THR-412
12.4
12.8
-4.2
20.2
51.4
55.2
-90.2

Graph shows rotational transition at bending residues and can be used
to identify hinge bending residues.
Probably only informative for interdomain rotations greater than 20 degrees
Residue
iResidue
i+1Distance of hinge axis to residue i in
(A) Distance of hinge axis to residue i in
(A) Change in
(deg) Change in
(deg) Angle of psi(i) axis to hinge axis
(deg) Angle of psi(i) axis to hinge axis
(deg) Percentage Progress
ASN-503
ASP-504
16.7
17.0
59.0
-21.1
6.0
29.0
266.8
ASP-504
MET-505
15.4
15.0
-3.6
-13.0
101.4
110.2
-11.7
MET-505
VAL-506
13.9
13.3
-7.6
1.4
100.7
92.4
-11.9
VAL-506
GLN-507
10.6
9.9
-9.1
5.6
34.9
28.6
47.8
GLN-507
TYR-508
10.9
9.8
9.2
-5.9
143.6
134.8
-45.4
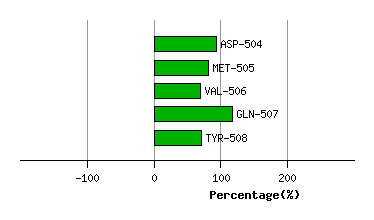
Graph shows rotational transition at bending residues and can be used
to identify hinge bending residues.
Probably only informative for interdomain rotations greater than 20 degrees
Residue
iResidue
i+1Distance of hinge axis to residue i in
(A) Distance of hinge axis to residue i in
(A) Change in
(deg) Change in
(deg) Angle of psi(i) axis to hinge axis
(deg) Angle of psi(i) axis to hinge axis
(deg) Percentage Progress
PHE-509
GLY-510
7.7
7.4
-10.1
17.6
95.0
97.2
39.2
GLY-510
GLU-511
6.1
5.1
-13.4
6.3
165.7
161.5
-24.6
GLU-511
GLN-512
6.8
5.6
-9.9
15.6
116.7
116.8
23.6

Graph shows rotational transition at bending residues and can be used
to identify hinge bending residues.
Probably only informative for interdomain rotations greater than 20 degrees
Residue
iResidue
i+1Distance of hinge axis to residue i in
(A) Distance of hinge axis to residue i in
(A) Change in
(deg) Change in
(deg) Angle of psi(i) axis to hinge axis
(deg) Angle of psi(i) axis to hinge axis
(deg) Percentage Progress
LEU-513
ASN-514
2.0
1.6
8.9
-15.5
100.7
101.8
29.2
ASN-514
GLY-515
1.8
2.3
4.2
-4.1
22.2
25.8
-18.3
GLY-515
PHE-516
3.9
4.4
14.7
-11.9
76.5
75.5
15.0

Graph shows rotational transition at bending residues and can be used
to identify hinge bending residues.
Probably only informative for interdomain rotations greater than 20 degrees
Residue
iResidue
i+1Distance of hinge axis to residue i in
(A) Distance of hinge axis to residue i in
(A) Change in
(deg) Change in
(deg) Angle of psi(i) axis to hinge axis
(deg) Angle of psi(i) axis to hinge axis
(deg) Percentage Progress
ILE-537
VAL-538
6.1
6.1
-1.4
11.9
93.9
94.9
17.7
VAL-538
GLY-539
8.3
8.5
-12.5
3.1
97.1
89.5
-6.9
GLY-539
ASP-540
7.4
7.9
-12.3
17.2
77.7
76.4
-21.2

Graph shows rotational transition at bending residues and can be used
to identify hinge bending residues.
Probably only informative for interdomain rotations greater than 20 degrees
Residue
iResidue
i+1Distance of hinge axis to residue i in
(A) Distance of hinge axis to residue i in
(A) Change in
(deg) Change in
(deg) Angle of psi(i) axis to hinge axis
(deg) Angle of psi(i) axis to hinge axis
(deg) Percentage Progress
PRO-570
VAL-571
6.4
5.8
-4.7
3.7
131.0
130.5
-7.6
VAL-571
THR-572
5.8
5.3
-2.3
1.9
73.0
72.8
-11.7
THR-572
ILE-573
8.4
8.0
-2.9
-0.4
40.3
39.7
17.4

Graph shows rotational transition at bending residues and can be used
to identify hinge bending residues.
Probably only informative for interdomain rotations greater than 20 degrees
Residue
iResidue
i+1Distance of hinge axis to residue i in
(A) Distance of hinge axis to residue i in
(A) Change in
(deg) Change in
(deg) Angle of psi(i) axis to hinge axis
(deg) Angle of psi(i) axis to hinge axis
(deg) Percentage Progress
SER-577
PHE-578
8.4
8.2
0.2
-1.4
123.3
121.9
-13.4
PHE-578
PRO-579
9.7
9.7
9.3
-10.5
89.8
87.9
11.0
PRO-579
ARG-580
7.3
7.2
-0.7
-1.8
102.1
99.0
23.1
ARG-580
ASP-581
8.4
8.7
-8.2
-24.0
44.1
23.5
181.9
ASP-581
ASP-582
11.8
11.3
47.0
-31.3
111.6
96.2
-105.1
ASP-582
VAL-583
12.1
12.4
29.7
-15.1
133.5
107.6
-85.6
VAL-583
SER-584
9.3
9.7
-10.2
6.2
50.5
53.8
-41.9

Graph shows rotational transition at bending residues and can be used
to identify hinge bending residues.
Probably only informative for interdomain rotations greater than 20 degrees
Residue
iResidue
i+1Distance of hinge axis to residue i in
(A) Distance of hinge axis to residue i in
(A) Change in
(deg) Change in
(deg) Angle of psi(i) axis to hinge axis
(deg) Angle of psi(i) axis to hinge axis
(deg) Percentage Progress
GLN-591
LEU-592
5.8
6.0
2.3
-5.9
66.4
66.9
3.3
LEU-592
GLY-593
4.7
4.3
6.2
-2.6
96.3
97.5
21.2
GLY-593
LEU-594
8.1
7.7
12.0
-9.3
44.0
47.0
41.7

Graph shows rotational transition at bending residues and can be used
to identify hinge bending residues.
Probably only informative for interdomain rotations greater than 20 degrees
Residue
iResidue
i+1Distance of hinge axis to residue i in
(A) Distance of hinge axis to residue i in
(A) Change in
(deg) Change in
(deg) Angle of psi(i) axis to hinge axis
(deg) Angle of psi(i) axis to hinge axis
(deg) Percentage Progress
PRO-616
ALA-617
13.7
13.8
-13.7
-4.2
123.4
124.1
-84.3
ALA-617
ILE-618
10.7
10.8
6.6
2.2
43.5
46.0
39.6
ILE-618
ARG-619
9.4
9.2
-12.6
18.8
155.9
148.9
62.8

Graph shows rotational transition at bending residues and can be used
to identify hinge bending residues.
Probably only informative for interdomain rotations greater than 20 degrees
Residue
iResidue
i+1Distance of hinge axis to residue i in
(A) Distance of hinge axis to residue i in
(A) Change in
(deg) Change in
(deg) Angle of psi(i) axis to hinge axis
(deg) Angle of psi(i) axis to hinge axis
(deg) Percentage Progress
TYR-633
LEU-634
2.7
2.3
-0.5
-6.4
91.8
95.6
-10.2
LEU-634
ASN-635
6.1
5.7
11.8
1.0
59.3
67.0
53.0
ASN-635
TRP-636
8.1
7.5
9.4
-8.5
8.7
13.0
-7.2

Graph shows rotational transition at bending residues and can be used
to identify hinge bending residues.
Probably only informative for interdomain rotations greater than 20 degrees