Anthranilate Phosphoribosyltransferase
(All numbering and residues are taken from first PDB file)
![]()
![]()
Bending Residue Dihedral Analysis
Residue
iResidue
i+1Distance of hinge axis to residue i in
(A) Distance of hinge axis to residue i in
(A) Change in
(deg) Change in
(deg) Angle of psi(i) axis to hinge axis
(deg) Angle of psi(i) axis to hinge axis
(deg) Percentage Progress
ARG-63
GLU-64
6.1
6.2
3.8
-4.5
147.1
145.5
21.3
GLU-64
LEU-65
9.0
9.1
9.7
-5.5
143.4
146.4
-74.1
LEU-65
ALA-66
8.5
8.6
-0.9
1.0
75.1
74.0
-7.9
ALA-66
ILE-67
4.8
4.8
-6.8
-2.4
41.4
44.9
111.1
ILE-67
LYS-68
2.3
2.4
-4.6
9.8
122.5
124.0
51.9

Graph shows rotational transition at bending residues and can be used
to identify hinge bending residues.
Probably only informative for interdomain rotations greater than 20 degrees
Residue
iResidue
i+1Distance of hinge axis to residue i in
(A) Distance of hinge axis to residue i in
(A) Change in
(deg) Change in
(deg) Angle of psi(i) axis to hinge axis
(deg) Angle of psi(i) axis to hinge axis
(deg) Percentage Progress
PHE-149
ALA-150
8.8
8.6
9.4
-8.5
95.1
94.0
60.8
ALA-150
GLN-151
7.2
7.5
14.5
-26.1
51.4
46.3
-173.9
GLN-151
TYR-152
9.7
9.9
34.6
-18.6
29.2
29.6
201.8
TYR-152
TYR-153
7.6
7.3
-20.4
4.3
85.5
81.7
-52.3
TYR-153
HIS-154
4.2
3.9
-6.5
2.1
69.1
68.4
20.8
HIS-154
PRO-155
6.3
6.3
3.5
-1.0
58.2
56.5
14.8
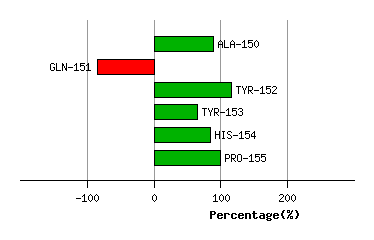
Graph shows rotational transition at bending residues and can be used
to identify hinge bending residues.
Probably only informative for interdomain rotations greater than 20 degrees
Residue
iResidue
i+1Distance of hinge axis to residue i in
(A) Distance of hinge axis to residue i in
(A) Change in
(deg) Change in
(deg) Angle of psi(i) axis to hinge axis
(deg) Angle of psi(i) axis to hinge axis
(deg) Percentage Progress
LEU-179
THR-180
1.7
1.7
-6.6
1.8
20.2
22.5
57.1
THR-180
ASN-181
2.0
2.1
3.4
1.1
129.5
130.8
-44.0
ASN-181
PRO-182
1.6
1.5
1.0
-2.8
145.2
147.0
36.3
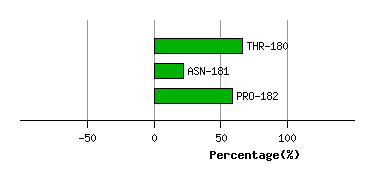
Graph shows rotational transition at bending residues and can be used
to identify hinge bending residues.
Probably only informative for interdomain rotations greater than 20 degrees
Residue
iResidue
i+1Distance of hinge axis to residue i in
(A) Distance of hinge axis to residue i in
(A) Change in
(deg) Change in
(deg) Angle of psi(i) axis to hinge axis
(deg) Angle of psi(i) axis to hinge axis
(deg) Percentage Progress
GLY-191
VAL-192
7.5
7.8
0.5
-14.4
90.9
103.4
14.1
VAL-192
PHE-193
7.5
8.0
-17.2
12.4
64.8
55.8
-48.2
PHE-193
SER-194
11.0
11.3
-20.6
16.2
24.7
21.6
61.2
SER-194
LYS-195
10.2
10.2
1.0
-0.9
115.2
108.8
20.8
LYS-195
ASP-196
7.6
7.2
-1.9
4.4
97.3
102.2
-18.9
ASP-196
HIS-197
8.3
8.2
-8.6
6.3
150.4
157.9
-21.1
HIS-197
LEU-198
7.1
7.3
9.9
-13.9
94.7
90.5
17.8
LEU-198
ASP-199
3.7
3.9
6.3
-9.5
100.3
99.1
30.5

Graph shows rotational transition at bending residues and can be used
to identify hinge bending residues.
Probably only informative for interdomain rotations greater than 20 degrees
Residue
iResidue
i+1Distance of hinge axis to residue i in
(A) Distance of hinge axis to residue i in
(A) Change in
(deg) Change in
(deg) Angle of psi(i) axis to hinge axis
(deg) Angle of psi(i) axis to hinge axis
(deg) Percentage Progress
TYR-206
GLU-207
7.8
7.5
2.8
2.3
128.5
127.6
-45.5
GLU-207
LEU-208
10.0
9.7
-1.1
-4.5
16.1
16.2
76.9
LEU-208
ASP-209
7.9
7.6
1.8
0.6
115.6
115.1
-7.2

Graph shows rotational transition at bending residues and can be used
to identify hinge bending residues.
Probably only informative for interdomain rotations greater than 20 degrees
Residue
iResidue
i+1Distance of hinge axis to residue i in
(A) Distance of hinge axis to residue i in
(A) Change in
(deg) Change in
(deg) Angle of psi(i) axis to hinge axis
(deg) Angle of psi(i) axis to hinge axis
(deg) Percentage Progress
LYS-234
ILE-235
4.0
3.7
-2.7
2.6
137.3
136.5
-0.1
ILE-235
VAL-236
6.9
6.7
-1.9
-1.0
102.2
102.6
7.7
VAL-236
SER-237
7.0
6.6
-3.9
11.2
125.6
127.9
30.1
SER-237
LYS-238
10.5
10.1
6.8
-0.6
95.1
89.0
-26.8

Graph shows rotational transition at bending residues and can be used
to identify hinge bending residues.
Probably only informative for interdomain rotations greater than 20 degrees
Residue
iResidue
i+1Distance of hinge axis to residue i in
(A) Distance of hinge axis to residue i in
(A) Change in
(deg) Change in
(deg) Angle of psi(i) axis to hinge axis
(deg) Angle of psi(i) axis to hinge axis
(deg) Percentage Progress
GLY-240
ILE-241
10.9
10.7
5.3
-2.5
91.6
93.2
-13.1
ILE-241
GLU-242
7.3
7.2
-8.9
1.8
148.3
145.4
-97.3
GLU-242
GLU-243
7.3
7.4
-2.7
-3.6
100.5
99.8
59.2

Graph shows rotational transition at bending residues and can be used
to identify hinge bending residues.
Probably only informative for interdomain rotations greater than 20 degrees