Succinyl-Coa:3-Ketoacid-Coenzyme A Transferase 1
(All numbering and residues are taken from first PDB file)
![]()
![]()
Bending Residue Dihedral Analysis
Residue
iResidue
i+1Distance of hinge axis to residue i in
(A) Distance of hinge axis to residue i in
(A) Change in
(deg) Change in
(deg) Angle of psi(i) axis to hinge axis
(deg) Angle of psi(i) axis to hinge axis
(deg) Percentage Progress
THR-159
GLY-160
6.8
6.6
-4.6
7.0
17.8
17.9
-49.2
GLY-160
TYR-161
4.7
4.7
2.8
-14.0
129.6
127.0
193.0
TYR-161
GLY-162
6.2
6.1
4.0
-12.5
96.7
99.3
-4.2
GLY-162
THR-163
4.7
5.0
1.5
13.5
102.7
95.9
-0.4
THR-163
LEU-164
1.2
1.2
4.1
-8.6
140.9
142.7
16.2
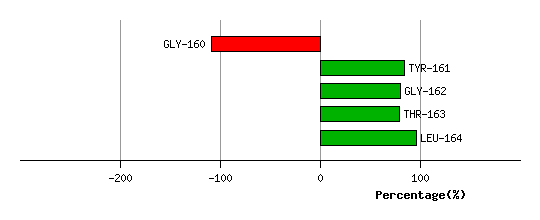
Graph shows rotational transition at bending residues and can be used
to identify hinge bending residues.
Probably only informative for interdomain rotations greater than 20 degrees
Residue
iResidue
i+1Distance of hinge axis to residue i in
(A) Distance of hinge axis to residue i in
(A) Change in
(deg) Change in
(deg) Angle of psi(i) axis to hinge axis
(deg) Angle of psi(i) axis to hinge axis
(deg) Percentage Progress
ASP-299
ASP-300
24.4
25.2
-11.6
18.4
104.2
109.7
-79.1
ASP-300
VAL-301
25.0
25.6
-6.7
-14.3
63.5
73.8
53.3
VAL-301
ARG-302
22.8
23.1
13.2
4.4
76.6
82.8
7.7
ARG-302
GLU-303
19.8
20.3
-23.7
16.9
163.3
158.4
-112.3
GLU-303
ARG-304
20.1
20.3
4.0
-0.9
86.4
84.1
-53.1

Graph shows rotational transition at bending residues and can be used
to identify hinge bending residues.
Probably only informative for interdomain rotations greater than 20 degrees
Residue
iResidue
i+1Distance of hinge axis to residue i in
(A) Distance of hinge axis to residue i in
(A) Change in
(deg) Change in
(deg) Angle of psi(i) axis to hinge axis
(deg) Angle of psi(i) axis to hinge axis
(deg) Percentage Progress
GLY-316
MET-317
3.7
4.1
4.0
-12.8
6.2
10.7
-108.5
MET-317
TYR-318
3.1
3.2
2.5
-4.4
70.4
70.1
125.1
TYR-318
ALA-319
2.6
2.7
4.5
-6.0
37.4
38.0
7.2
ALA-319
ASN-320
0.7
0.7
1.2
-5.2
60.3
59.7
-114.4
ASN-320
LEU-321
3.1
3.1
-2.6
-5.4
108.9
108.7
-77.3
LEU-321
GLY-322
6.1
5.9
9.6
10.4
40.8
46.9
23.1
GLY-322
ILE-323
7.6
8.1
-5.9
8.9
86.8
65.4
3.3
ILE-323
GLY-324
11.2
11.9
9.4
-19.9
75.8
88.7
46.5
GLY-324
ILE-325
13.5
14.2
0.8
19.7
147.7
128.9
-320.0
ILE-325
PRO-326
13.7
13.6
-17.3
1.5
43.9
55.8
283.2
PRO-326
LEU-327
10.3
9.9
-13.2
-5.4
47.8
39.8
311.5
LEU-327
LEU-328
11.6
10.6
0.4
-4.8
134.4
134.3
41.7
LEU-328
ALA-329
14.3
13.7
-3.6
16.6
49.0
57.0
-271.6
ALA-329
SER-330
12.1
11.9
-11.7
5.8
36.8
37.6
187.6
SER-330
ASN-331
10.2
9.5
1.3
8.2
143.0
146.3
-229.6
ASN-331
PHE-332
13.4
12.6
-7.9
11.0
60.9
54.2
37.8
PHE-332
ILE-333
13.2
12.7
12.8
-9.9
109.3
111.8
-13.6
ILE-333
SER-334
9.5
9.0
1.9
-6.7
173.2
176.2
181.7
SER-334
PRO-335
9.9
9.1
3.4
-0.9
123.3
113.1
6.3
PRO-335
ASN-336
8.7
7.2
2.0
3.6
125.0
120.5
-76.2
ASN-336
ILE-337
7.3
6.0
4.7
-2.3
66.6
51.6
-127.0
ILE-337
THR-338
4.6
4.1
-7.2
-4.8
109.7
112.2
-52.0
THR-338
VAL-339
1.7
1.2
2.7
5.4
17.0
16.4
98.6
VAL-339
HIS-340
1.9
1.4
16.8
-19.7
76.5
79.5
25.0
HIS-340
LEU-341
3.5
3.4
6.0
-8.0
19.0
20.1
-75.5
LEU-341
GLN-342
5.1
5.1
-1.8
2.5
117.2
117.5
126.2

Graph shows rotational transition at bending residues and can be used
to identify hinge bending residues.
Probably only informative for interdomain rotations greater than 20 degrees
Residue
iResidue
i+1Distance of hinge axis to residue i in
(A) Distance of hinge axis to residue i in
(A) Change in
(deg) Change in
(deg) Angle of psi(i) axis to hinge axis
(deg) Angle of psi(i) axis to hinge axis
(deg) Percentage Progress
ASP-395
LEU-396
5.0
5.1
-1.4
2.6
57.3
57.4
-100.1
LEU-396
THR-397
3.4
3.4
-8.5
-0.4
63.2
60.4
13.6
THR-397
MET-398
2.1
2.0
-13.3
0.1
80.9
80.5
189.6

Graph shows rotational transition at bending residues and can be used
to identify hinge bending residues.
Probably only informative for interdomain rotations greater than 20 degrees
Residue
iResidue
i+1Distance of hinge axis to residue i in
(A) Distance of hinge axis to residue i in
(A) Change in
(deg) Change in
(deg) Angle of psi(i) axis to hinge axis
(deg) Angle of psi(i) axis to hinge axis
(deg) Percentage Progress
TRP-413
MET-414
8.3
8.3
6.8
-2.6
34.6
35.0
37.5
MET-414
ILE-415
9.8
9.8
1.8
-1.2
66.2
67.5
50.3
ILE-415
PRO-416
12.4
12.4
8.8
1.6
33.1
27.2
189.4
PRO-416
GLY-417
12.2
12.1
-12.1
-30.3
104.9
104.6
-168.2
GLY-417
LYS-418
15.8
15.5
86.6
-36.4
134.6
141.5
-307.1
VAL-420
LYS-421
13.6
14.6
-13.6
11.8
53.1
45.9
-130.1
LYS-421
GLY-422
14.1
14.2
-10.6
-5.9
71.4
78.6
57.7
GLY-422
MET-423
10.9
11.0
-0.3
8.0
42.3
43.2
32.8
MET-423
GLY-424
7.9
8.0
-7.9
3.5
22.1
18.1
6.2

Graph shows rotational transition at bending residues and can be used
to identify hinge bending residues.
Probably only informative for interdomain rotations greater than 20 degrees
Residue
iResidue
i+1Distance of hinge axis to residue i in
(A) Distance of hinge axis to residue i in
(A) Change in
(deg) Change in
(deg) Angle of psi(i) axis to hinge axis
(deg) Angle of psi(i) axis to hinge axis
(deg) Percentage Progress
VAL-430
SER-431
2.4
2.2
-12.4
3.7
66.1
69.2
59.6
SER-431
SER-432
5.5
5.3
3.4
5.5
59.9
59.6
4.1
SER-432
ALA-433
7.8
7.7
-8.8
12.0
103.5
104.5
171.1
ALA-433
LYS-434
10.2
10.1
-11.0
2.4
175.0
172.8
-123.0

Graph shows rotational transition at bending residues and can be used
to identify hinge bending residues.
Probably only informative for interdomain rotations greater than 20 degrees