Protein (Ribokinase)
(All numbering and residues are taken from first PDB file)
![]()
![]()
Bending Residue Dihedral Analysis
Residue
iResidue
i+1Distance of hinge axis to residue i in
(A) Distance of hinge axis to residue i in
(A) Change in
(deg) Change in
(deg) Angle of psi(i) axis to hinge axis
(deg) Angle of psi(i) axis to hinge axis
(deg) Percentage Progress
SER-12
ILE-13
3.4
3.3
4.4
2.0
101.5
104.1
-33.5
ILE-13
ASN-14
2.4
2.3
1.2
1.3
165.2
167.4
65.4
ASN-14
ALA-15
2.2
2.0
2.5
-2.8
116.5
112.8
112.0

Graph shows rotational transition at bending residues and can be used
to identify hinge bending residues.
Probably only informative for interdomain rotations greater than 20 degrees
Residue
iResidue
i+1Distance of hinge axis to residue i in
(A) Distance of hinge axis to residue i in
(A) Change in
(deg) Change in
(deg) Angle of psi(i) axis to hinge axis
(deg) Angle of psi(i) axis to hinge axis
(deg) Percentage Progress
GLY-41
GLY-42
3.6
3.7
-2.6
-10.4
57.7
52.3
72.6
GLY-42
LYS-43
1.7
1.9
-12.6
7.2
52.3
43.7
-39.5
LYS-43
GLY-44
4.9
4.9
-10.5
-3.8
22.2
22.4
150.9

Graph shows rotational transition at bending residues and can be used
to identify hinge bending residues.
Probably only informative for interdomain rotations greater than 20 degrees
Residue
iResidue
i+1Distance of hinge axis to residue i in
(A) Distance of hinge axis to residue i in
(A) Change in
(deg) Change in
(deg) Angle of psi(i) axis to hinge axis
(deg) Angle of psi(i) axis to hinge axis
(deg) Percentage Progress
ASP-66
ASP-67
14.6
15.1
0.6
-35.2
154.3
138.1
200.1
ASP-67
SER-68
13.9
14.5
5.5
-5.6
74.6
79.0
16.5
SER-68
ILE-69
14.2
14.7
-4.1
12.8
115.8
101.2
70.4
ILE-69
GLY-70
10.8
11.1
-7.0
0.7
158.5
163.4
-80.4
GLY-70
GLU-71
10.6
10.6
6.6
14.6
49.1
51.6
168.9
GLU-71
SER-72
13.8
13.5
-40.5
46.3
95.2
91.8
-55.4
SER-72
VAL-73
13.2
12.9
-24.4
10.2
117.1
123.1
-95.5
VAL-73
ARG-74
9.7
9.4
-6.8
6.0
173.3
170.5
-78.0
ARG-74
GLN-75
10.3
10.5
-3.2
-2.9
104.6
106.7
54.9
GLN-75
GLN-76
13.4
13.5
2.0
0.8
102.5
90.1
-1.5
GLN-76
LEU-77
12.1
12.1
3.4
3.5
45.0
38.8
51.6
LEU-77
ALA-78
9.3
9.3
5.6
-17.2
27.7
31.8
-102.5

Graph shows rotational transition at bending residues and can be used
to identify hinge bending residues.
Probably only informative for interdomain rotations greater than 20 degrees
Residue
iResidue
i+1Distance of hinge axis to residue i in
(A) Distance of hinge axis to residue i in
(A) Change in
(deg) Change in
(deg) Angle of psi(i) axis to hinge axis
(deg) Angle of psi(i) axis to hinge axis
(deg) Percentage Progress
GLY-96
VAL-97
6.1
5.8
-4.3
-4.7
46.8
46.7
203.5
VAL-97
ALA-98
3.9
3.7
-5.8
2.7
80.8
78.9
-14.2
ALA-98
LEU-99
1.9
1.8
-0.1
-3.4
24.9
25.4
-13.9
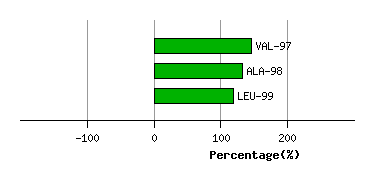
Graph shows rotational transition at bending residues and can be used
to identify hinge bending residues.
Probably only informative for interdomain rotations greater than 20 degrees
Residue
iResidue
i+1Distance of hinge axis to residue i in
(A) Distance of hinge axis to residue i in
(A) Change in
(deg) Change in
(deg) Angle of psi(i) axis to hinge axis
(deg) Angle of psi(i) axis to hinge axis
(deg) Percentage Progress
ILE-110
GLY-111
7.4
7.5
-13.3
16.3
92.1
92.9
-41.4
GLY-111
ILE-112
7.1
6.8
6.3
-7.0
124.1
127.3
26.2
ILE-112
HIS-113
6.2
6.1
-23.0
24.3
93.6
91.6
-2.1
HIS-113
ALA-114
7.9
7.5
-5.9
-7.4
21.8
12.8
151.5
ALA-114
GLY-115
8.8
8.6
3.6
-6.2
100.1
108.2
61.5
GLY-115
ALA-116
10.1
10.1
9.8
-1.6
165.7
167.6
-105.6
ALA-116
ASN-117
10.5
10.4
-4.8
3.7
48.3
52.9
88.3
ASN-117
ALA-118
8.3
8.2
-0.8
-3.5
73.7
77.3
-42.5
ALA-118
ALA-119
11.8
11.7
-3.4
-4.3
47.7
44.6
53.6

Graph shows rotational transition at bending residues and can be used
to identify hinge bending residues.
Probably only informative for interdomain rotations greater than 20 degrees
Residue
iResidue
i+1Distance of hinge axis to residue i in
(A) Distance of hinge axis to residue i in
(A) Change in
(deg) Change in
(deg) Angle of psi(i) axis to hinge axis
(deg) Angle of psi(i) axis to hinge axis
(deg) Percentage Progress
ALA-285
VAL-286
16.6
16.6
4.3
-2.8
154.0
158.6
4.5
VAL-286
THR-287
17.8
17.8
7.6
-9.3
124.5
126.8
-15.0
THR-287
ARG-288
20.3
20.0
-5.2
6.7
72.9
76.4
34.2
ARG-288
LYS-289
17.7
17.3
11.3
-9.8
120.4
118.3
9.4
LYS-289
GLY-290
15.0
14.4
-9.6
-1.7
118.6
118.1
-85.5
GLY-290
ALA-291
11.4
10.7
11.1
5.2
37.1
28.2
135.5
ALA-291
GLN-292
9.5
9.1
3.9
-8.2
30.5
43.2
14.0
GLN-292
PRO-293
9.0
9.4
8.1
-2.6
87.3
94.7
45.7
PRO-293
SER-294
12.3
12.7
2.1
-4.5
79.0
79.5
-43.5
SER-294
VAL-295
14.1
14.1
6.7
-17.0
17.8
17.7
5.9
VAL-295
PRO-296
13.5
13.5
-5.6
7.2
118.9
123.3
9.0

Graph shows rotational transition at bending residues and can be used
to identify hinge bending residues.
Probably only informative for interdomain rotations greater than 20 degrees