Udp-N-Acetylglucosamine Enolpyruvyl Transferase
(All numbering and residues are taken from first PDB file)
![]()
![]()
Bending Residue Dihedral Analysis
Residue
iResidue
i+1Distance of hinge axis to residue i in
(A) Distance of hinge axis to residue i in
(A) Change in
(deg) Change in
(deg) Angle of psi(i) axis to hinge axis
(deg) Angle of psi(i) axis to hinge axis
(deg) Percentage Progress
ILE-18
SER-19
8.1
7.7
-1.0
0.9
92.0
92.5
9.2
SER-19
GLY-20
4.5
4.1
11.4
3.7
26.6
26.3
84.3
GLY-20
ALA-21
2.6
2.0
0.8
5.0
89.1
81.9
12.4

Graph shows rotational transition at bending residues and can be used
to identify hinge bending residues.
Probably only informative for interdomain rotations greater than 20 degrees
Residue
iResidue
i+1Distance of hinge axis to residue i in
(A) Distance of hinge axis to residue i in
(A) Change in
(deg) Change in
(deg) Angle of psi(i) axis to hinge axis
(deg) Angle of psi(i) axis to hinge axis
(deg) Percentage Progress
VAL-228
LEU-229
5.0
4.1
4.4
-5.4
94.5
92.7
31.0
LEU-229
PRO-230
3.9
3.4
5.9
3.3
37.3
38.5
43.8
PRO-230
ASP-231
5.1
4.9
-2.7
-4.0
88.7
87.3
9.2
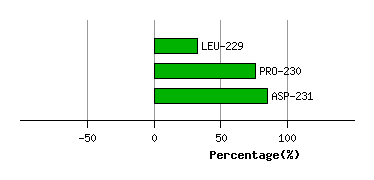
Graph shows rotational transition at bending residues and can be used
to identify hinge bending residues.
Probably only informative for interdomain rotations greater than 20 degrees
Residue
iResidue
i+1Distance of hinge axis to residue i in
(A) Distance of hinge axis to residue i in
(A) Change in
(deg) Change in
(deg) Angle of psi(i) axis to hinge axis
(deg) Angle of psi(i) axis to hinge axis
(deg) Percentage Progress
TYR-393
HIS-394
11.8
12.5
-4.2
11.5
174.5
174.6
42.1
HIS-394
ILE-395
12.4
13.5
-1.4
-3.3
102.4
109.6
-42.0
ILE-395
ASP-396
10.1
10.8
18.2
-15.3
100.8
88.2
-2.3
ASP-396
ARG-397
7.4
8.1
23.8
6.4
136.2
145.0
-132.6
ASP-396
ARG-397
7.4
8.1
23.8
6.4
136.2
145.0
-132.6

Graph shows rotational transition at bending residues and can be used
to identify hinge bending residues.
Probably only informative for interdomain rotations greater than 20 degrees
Residue
iResidue
i+1Distance of hinge axis to residue i in
(A) Distance of hinge axis to residue i in
(A) Change in
(deg) Change in
(deg) Angle of psi(i) axis to hinge axis
(deg) Angle of psi(i) axis to hinge axis
(deg) Percentage Progress
ASP-396
ARG-397
7.4
8.1
23.8
6.4
136.2
145.0
-132.6
ASP-396
ARG-397
7.4
8.1
23.8
6.4
136.2
145.0
-132.6
ARG-397
GLY-398
8.1
9.3
-15.1
-15.3
28.0
43.3
159.6
GLY-398
TYR-399
7.3
7.5
18.3
0.9
91.1
75.6
22.8

Graph shows rotational transition at bending residues and can be used
to identify hinge bending residues.
Probably only informative for interdomain rotations greater than 20 degrees
Residue
iResidue
i+1Distance of hinge axis to residue i in
(A) Distance of hinge axis to residue i in
(A) Change in
(deg) Change in
(deg) Angle of psi(i) axis to hinge axis
(deg) Angle of psi(i) axis to hinge axis
(deg) Percentage Progress
ILE-413
GLU-414
13.1
13.3
7.0
-22.4
127.7
126.6
60.2
GLU-414
ARG-415
11.1
11.0
-5.5
4.5
107.3
101.9
-9.6
ARG-415
VAL-416
9.4
9.6
-1.0
-18.0
33.1
25.5
103.8
VAL-416
LYS-417
11.4
11.1
30.4
20.4
84.6
85.2
-2.1
LYS-417
GLY-418
11.0
12.1
-174.2
-5.9
69.1
95.5
58.2

Graph shows rotational transition at bending residues and can be used
to identify hinge bending residues.
Probably only informative for interdomain rotations greater than 20 degrees