Glutaminyl-Trna Synthetase
(All numbering and residues are taken from first PDB file)
![]()
![]()
Bending Residue Dihedral Analysis
Residue
iResidue
i+1Distance of hinge axis to residue i in
(A) Distance of hinge axis to residue i in
(A) Change in
(deg) Change in
(deg) Angle of psi(i) axis to hinge axis
(deg) Angle of psi(i) axis to hinge axis
(deg) Percentage Progress
PHE-31
PRO-32
12.7
12.3
-3.4
17.9
103.9
109.4
-25.2
PRO-32
PRO-33
12.4
12.3
10.3
12.2
52.0
64.4
83.3
PRO-33
GLU-34
15.9
16.0
89.2
-91.4
82.3
54.2
22.7
GLU-34
PRO-35
16.9
17.8
-25.7
15.9
66.6
65.1
175.4
PRO-35
ASN-36
20.1
20.2
-44.9
12.0
132.1
133.5
-237.5
ASN-36
GLY-37
22.4
22.2
-38.5
34.1
93.8
91.7
-17.1
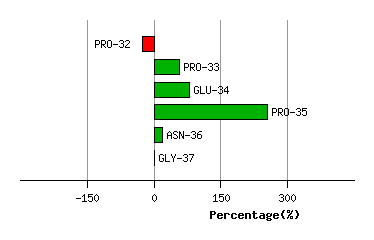
Graph shows rotational transition at bending residues and can be used
to identify hinge bending residues.
Probably only informative for interdomain rotations greater than 20 degrees
Residue
iResidue
i+1Distance of hinge axis to residue i in
(A) Distance of hinge axis to residue i in
(A) Change in
(deg) Change in
(deg) Angle of psi(i) axis to hinge axis
(deg) Angle of psi(i) axis to hinge axis
(deg) Percentage Progress
ARG-64
PHE-65
11.7
11.3
-17.1
7.4
134.5
131.8
-36.0
PHE-65
ASP-66
14.5
14.5
50.1
-40.2
42.9
53.2
51.5
ASP-66
ASP-67
13.1
14.5
15.4
1.7
68.7
82.2
136.0
ASP-67
THR-68
16.0
17.5
-38.2
32.5
124.7
123.8
-24.4
THR-68
ASN-69
15.4
16.4
-20.6
47.7
129.7
123.5
160.4
ASN-69
PRO-70
18.4
19.4
15.8
-22.2
120.4
117.7
1.2
LYS-72
GLU-73
22.9
26.2
58.8
45.3
154.2
117.3
-829.9
GLU-73
ASP-74
22.8
23.8
160.7
-160.1
123.2
105.3
180.7
ASP-74
ILE-75
25.2
26.8
-87.2
19.2
23.0
38.6
591.2
ILE-75
GLU-76
24.8
25.5
122.4
-118.7
108.6
104.0
-156.3
GLU-76
TYR-77
27.0
26.4
0.4
6.0
85.9
72.2
-24.3

Graph shows rotational transition at bending residues and can be used
to identify hinge bending residues.
Probably only informative for interdomain rotations greater than 20 degrees
Residue
iResidue
i+1Distance of hinge axis to residue i in
(A) Distance of hinge axis to residue i in
(A) Change in
(deg) Change in
(deg) Angle of psi(i) axis to hinge axis
(deg) Angle of psi(i) axis to hinge axis
(deg) Percentage Progress
TYR-98
SER-99
13.1
12.8
-16.5
11.0
127.4
128.1
0.0
SER-99
SER-100
11.8
11.7
0.5
-1.7
95.9
93.6
44.7
SER-100
ASP-101
14.8
14.8
2.8
3.8
139.5
137.1
-36.0

Graph shows rotational transition at bending residues and can be used
to identify hinge bending residues.
Probably only informative for interdomain rotations greater than 20 degrees
Residue
iResidue
i+1Distance of hinge axis to residue i in
(A) Distance of hinge axis to residue i in
(A) Change in
(deg) Change in
(deg) Angle of psi(i) axis to hinge axis
(deg) Angle of psi(i) axis to hinge axis
(deg) Percentage Progress
HIS-215
CYS-216
6.1
6.3
-7.4
9.9
110.6
107.1
30.0
CYS-216
ILE-217
2.4
2.6
0.0
0.4
135.5
135.4
20.7
ILE-217
SER-218
4.6
4.7
-0.7
1.9
151.9
155.0
-40.7

Graph shows rotational transition at bending residues and can be used
to identify hinge bending residues.
Probably only informative for interdomain rotations greater than 20 degrees
Residue
iResidue
i+1Distance of hinge axis to residue i in
(A) Distance of hinge axis to residue i in
(A) Change in
(deg) Change in
(deg) Angle of psi(i) axis to hinge axis
(deg) Angle of psi(i) axis to hinge axis
(deg) Percentage Progress
ASP-235
ASN-236
7.3
6.4
-5.4
11.9
59.8
55.4
-54.8
ASN-236
ARG-237
5.3
4.8
-6.5
-3.7
54.5
55.6
107.9
ARG-237
ARG-238
4.8
4.5
2.3
-6.7
70.8
65.4
-15.2

Graph shows rotational transition at bending residues and can be used
to identify hinge bending residues.
Probably only informative for interdomain rotations greater than 20 degrees
Residue
iResidue
i+1Distance of hinge axis to residue i in
(A) Distance of hinge axis to residue i in
(A) Change in
(deg) Change in
(deg) Angle of psi(i) axis to hinge axis
(deg) Angle of psi(i) axis to hinge axis
(deg) Percentage Progress
PRO-250
VAL-251
9.1
8.9
-56.4
32.7
84.7
70.3
-11.4
VAL-251
HIS-252
6.6
6.8
-17.4
24.2
25.7
25.9
-38.8
HIS-252
PRO-253
5.6
5.9
11.5
-10.4
86.5
90.8
-0.6

Graph shows rotational transition at bending residues and can be used
to identify hinge bending residues.
Probably only informative for interdomain rotations greater than 20 degrees