Pyruvate Kinase, M2 Isozyme
(All numbering and residues are taken from first PDB file)
![]()
![]()
Bending Residue Dihedral Analysis
Residue
iResidue
i+1Distance of hinge axis to residue i in
(A) Distance of hinge axis to residue i in
(A) Change in
(deg) Change in
(deg) Angle of psi(i) axis to hinge axis
(deg) Angle of psi(i) axis to hinge axis
(deg) Percentage Progress
THR-113
LYS-114
7.9
8.1
2.0
-11.3
109.5
103.7
38.6
LYS-114
GLY-115
5.2
5.0
-13.6
-14.7
68.0
70.5
72.5
GLY-115
PRO-116
3.2
3.1
19.2
14.4
76.4
90.5
0.0

Graph shows rotational transition at bending residues and can be used
to identify hinge bending residues.
Probably only informative for interdomain rotations greater than 20 degrees
Residue
iResidue
i+1Distance of hinge axis to residue i in
(A) Distance of hinge axis to residue i in
(A) Change in
(deg) Change in
(deg) Angle of psi(i) axis to hinge axis
(deg) Angle of psi(i) axis to hinge axis
(deg) Percentage Progress
VAL-175
ASP-176
12.0
11.8
15.7
-13.9
80.3
75.9
-17.6
ASP-176
ASP-177
11.3
11.8
25.5
-4.0
39.5
35.9
110.6
ASP-177
GLY-178
8.5
9.4
-11.7
6.3
153.0
150.5
-36.5
GLY-178
LEU-179
9.5
9.3
11.6
-37.6
66.7
58.6
-111.0
LEU-179
ILE-180
12.9
12.9
14.6
6.7
84.2
95.8
39.6

Graph shows rotational transition at bending residues and can be used
to identify hinge bending residues.
Probably only informative for interdomain rotations greater than 20 degrees
Residue
iResidue
i+1Distance of hinge axis to residue i in
(A) Distance of hinge axis to residue i in
(A) Change in
(deg) Change in
(deg) Angle of psi(i) axis to hinge axis
(deg) Angle of psi(i) axis to hinge axis
(deg) Percentage Progress
ALA-213
ALA-214
12.6
13.4
-0.7
8.7
56.0
59.3
-22.1
ALA-214
VAL-215
13.1
12.8
61.3
-60.4
158.6
149.5
-26.9
VAL-215
ASP-216
11.0
10.5
-4.1
8.4
48.8
51.9
-81.8
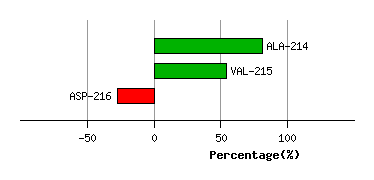
Graph shows rotational transition at bending residues and can be used
to identify hinge bending residues.
Probably only informative for interdomain rotations greater than 20 degrees