P58-Cl42 Kir
(All numbering and residues are taken from first PDB file)
![]()
![]()
Bending Residue Dihedral Analysis
Residue
iResidue
i+1Distance of hinge axis to residue i in
(A) Distance of hinge axis to residue i in
(A) Change in
(deg) Change in
(deg) Angle of psi(i) axis to hinge axis
(deg) Angle of psi(i) axis to hinge axis
(deg) Percentage Progress
ALA-12
HIS-13
7.0
7.6
-26.8
-11.8
50.9
68.4
112.0
HIS-13
PRO-14
4.9
5.8
32.7
6.7
74.6
101.2
-3.2
PRO-14
GLY-15
5.2
4.9
17.1
16.1
40.2
23.9
127.1
GLY-15
PRO-16
6.4
5.5
-8.1
-19.1
42.8
55.5
102.5
GLY-15
PRO-16
6.4
5.5
-8.1
-19.1
42.8
55.5
102.5

Graph shows rotational transition at bending residues and can be used
to identify hinge bending residues.
Probably only informative for interdomain rotations greater than 20 degrees
Residue
iResidue
i+1Distance of hinge axis to residue i in
(A) Distance of hinge axis to residue i in
(A) Change in
(deg) Change in
(deg) Angle of psi(i) axis to hinge axis
(deg) Angle of psi(i) axis to hinge axis
(deg) Percentage Progress
GLY-15
PRO-16
6.4
5.5
-8.1
-19.1
42.8
55.5
102.5
GLY-15
PRO-16
6.4
5.5
-8.1
-19.1
42.8
55.5
102.5
PRO-16
LEU-17
5.8
6.2
-23.0
7.3
46.9
46.7
101.2
LEU-17
VAL-18
4.8
4.7
-25.5
32.6
118.5
115.0
36.7
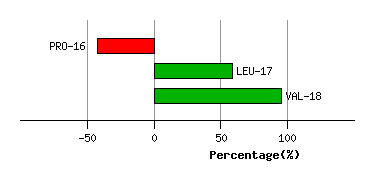
Graph shows rotational transition at bending residues and can be used
to identify hinge bending residues.
Probably only informative for interdomain rotations greater than 20 degrees
Residue
iResidue
i+1Distance of hinge axis to residue i in
(A) Distance of hinge axis to residue i in
(A) Change in
(deg) Change in
(deg) Angle of psi(i) axis to hinge axis
(deg) Angle of psi(i) axis to hinge axis
(deg) Percentage Progress
ARG-68
MET-69
7.9
7.9
13.9
14.2
38.4
21.0
76.5
MET-69
THR-70
5.3
5.6
-30.9
38.6
150.4
144.7
55.2
THR-70
GLN-71
7.2
8.1
-8.8
35.0
130.5
137.2
93.7
GLN-71
ASP-72
6.4
6.8
-55.4
9.0
86.0
91.3
-40.5
ASP-72
LEU-73
9.5
8.5
22.0
11.9
131.4
138.3
-115.1

Graph shows rotational transition at bending residues and can be used
to identify hinge bending residues.
Probably only informative for interdomain rotations greater than 20 degrees
Residue
iResidue
i+1Distance of hinge axis to residue i in
(A) Distance of hinge axis to residue i in
(A) Change in
(deg) Change in
(deg) Angle of psi(i) axis to hinge axis
(deg) Angle of psi(i) axis to hinge axis
(deg) Percentage Progress
ASP-98
ILE-99
8.8
8.5
-28.2
14.5
59.7
66.2
-4.1
ILE-99
VAL-100
5.5
5.3
0.1
9.2
39.9
43.2
32.9
VAL-100
ILE-101
2.9
2.5
-23.8
8.1
72.1
67.3
53.0
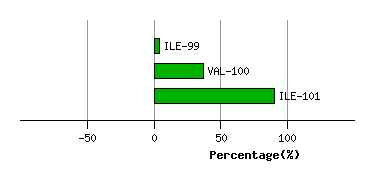
Graph shows rotational transition at bending residues and can be used
to identify hinge bending residues.
Probably only informative for interdomain rotations greater than 20 degrees