Plasminogen Activator Inhibitor-1
(All numbering and residues are taken from first PDB file)
![]()
![]()
Bending Residue Dihedral Analysis
Residue
iResidue
i+1Distance of hinge axis to residue i in
(A) Distance of hinge axis to residue i in
(A) Change in
(deg) Change in
(deg) Angle of psi(i) axis to hinge axis
(deg) Angle of psi(i) axis to hinge axis
(deg) Percentage Progress
PRO-180
ASP-181
6.6
5.8
28.8
8.9
81.0
90.8
-5.2
ASP-181
SER-182
2.9
2.0
160.7
-30.7
41.4
86.2
271.2
SER-182
SER-183
3.4
3.7
23.3
19.3
96.0
73.3
-225.0
SER-183
THR-184
6.3
4.4
-3.3
-26.3
59.4
137.0
-106.7

Graph shows rotational transition at bending residues and can be used
to identify hinge bending residues.
Probably only informative for interdomain rotations greater than 20 degrees
Residue
iResidue
i+1Distance of hinge axis to residue i in
(A) Distance of hinge axis to residue i in
(A) Change in
(deg) Change in
(deg) Angle of psi(i) axis to hinge axis
(deg) Angle of psi(i) axis to hinge axis
(deg) Percentage Progress
MET-201
MET-202
8.6
8.8
-25.9
6.6
64.8
73.6
46.3
MET-202
ALA-203
6.8
6.9
-14.1
-3.3
82.0
88.6
1.9
ALA-203
GLN-204
9.6
9.8
15.7
-11.4
97.1
107.7
-8.2
GLN-204
THR-205
11.5
11.8
-2.2
-18.7
94.8
101.9
-38.7
THR-205
ASN-206
15.2
15.5
-1.8
-2.5
124.9
102.4
-37.0

Graph shows rotational transition at bending residues and can be used
to identify hinge bending residues.
Probably only informative for interdomain rotations greater than 20 degrees
Residue
iResidue
i+1Distance of hinge axis to residue i in
(A) Distance of hinge axis to residue i in
(A) Change in
(deg) Change in
(deg) Angle of psi(i) axis to hinge axis
(deg) Angle of psi(i) axis to hinge axis
(deg) Percentage Progress
LYS-323
VAL-324
8.7
10.0
1.2
-9.3
55.8
57.3
-48.7
VAL-324
LYS-325
6.0
7.4
7.6
-10.0
15.5
11.5
11.4
LYS-325
ILE-326
5.9
7.1
10.4
-12.4
65.2
63.9
-12.6

Graph shows rotational transition at bending residues and can be used
to identify hinge bending residues.
Probably only informative for interdomain rotations greater than 20 degrees
Residue
iResidue
i+1Distance of hinge axis to residue i in
(A) Distance of hinge axis to residue i in
(A) Change in
(deg) Change in
(deg) Angle of psi(i) axis to hinge axis
(deg) Angle of psi(i) axis to hinge axis
(deg) Percentage Progress
ASN-329
GLU-330
1.0
0.5
-10.1
7.4
68.2
68.4
31.0
GLU-330
SER-331
3.3
2.7
6.2
44.3
70.0
68.2
89.8
SER-331
GLY-332
5.7
5.1
-1.4
92.8
155.4
165.7
411.9
GLY-332
THR-333
5.1
4.3
-156.0
-21.7
83.6
125.0
-572.7
THR-333
VAL-334
8.0
2.2
-43.0
-38.4
53.0
124.5
3.0
VAL-334
ALA-335
9.2
3.6
120.2
-70.7
156.7
49.6
-165.6
ALA-335
SER-336
9.2
2.8
-30.9
-7.2
54.5
146.2
-97.9
SER-336
SER-337
7.1
5.0
91.7
171.1
117.0
49.9
422.3
ALA-348
PRO-349
20.9
21.2
30.6
0.3
33.4
115.7
56.3
PRO-349
GLU-350
21.9
21.8
-1.9
-76.7
118.3
52.5
283.6
GLU-350
GLU-351
22.4
19.6
2.6
0.9
78.1
145.7
19.9
GLU-351
ILE-352
19.5
20.1
7.3
-12.0
25.3
107.4
60.1
ILE-352
ILE-353
18.3
19.6
20.8
-0.5
97.9
163.4
-6.9
ILE-353
ILE-354
16.7
19.1
23.9
-45.4
35.4
93.7
-13.9
ILE-354
ASP-355
15.3
20.2
51.0
-52.7
108.3
161.0
36.4
ASP-355
ARG-356
16.6
20.2
103.0
103.5
54.5
87.1
-445.9
ARG-356
PRO-357
18.2
20.3
-46.8
-71.3
146.6
77.3
-278.2
PRO-357
PHE-358
17.0
16.8
40.7
24.8
64.3
83.3
101.2
PHE-358
LEU-359
15.1
15.3
6.3
-10.3
36.8
42.6
35.7
LEU-359
PHE-360
13.3
13.4
0.1
-15.3
107.9
104.8
23.3
PHE-360
VAL-361
10.3
10.3
2.0
-5.7
26.1
29.9
-7.7
VAL-361
VAL-362
9.5
9.1
1.9
-7.4
107.8
106.9
11.0
VAL-362
ARG-363
7.5
7.0
7.5
-24.6
35.2
35.2
-73.4
ARG-363
HIS-364
10.1
9.4
7.1
-12.4
91.7
96.1
4.8
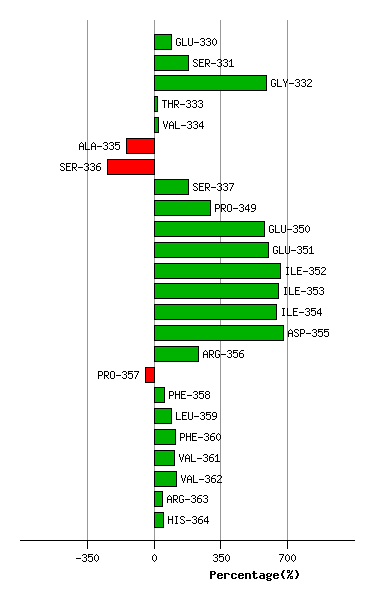
Graph shows rotational transition at bending residues and can be used
to identify hinge bending residues.
Probably only informative for interdomain rotations greater than 20 degrees