Myosin Heavy Chain
(All numbering and residues are taken from first PDB file)
![]()
![]()
Bending Residue Dihedral Analysis
Residue
iResidue
i+1Distance of hinge axis to residue i in
(A) Distance of hinge axis to residue i in
(A) Change in
(deg) Change in
(deg) Angle of psi(i) axis to hinge axis
(deg) Angle of psi(i) axis to hinge axis
(deg) Percentage Progress
HIS-490
HIS-491
7.8
7.7
17.0
-0.5
67.2
80.9
14.2
HIS-491
MET-492
7.1
7.5
-28.7
32.5
93.8
107.9
6.7
MET-492
PHE-493
3.4
3.8
6.2
51.6
43.4
18.2
68.9
PHE-493
ILE-494
2.7
3.9
4.8
-7.0
36.6
47.9
-1.2
ILE-494
LEU-495
5.9
6.4
2.7
9.2
57.6
88.7
11.9
LEU-495
GLU-496
6.1
6.2
15.9
-26.5
57.7
57.7
-4.6
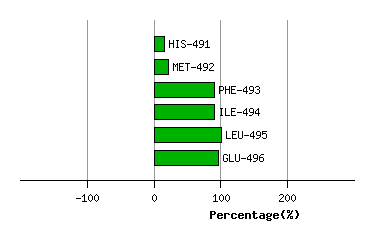
Graph shows rotational transition at bending residues and can be used
to identify hinge bending residues.
Probably only informative for interdomain rotations greater than 20 degrees
Residue
iResidue
i+1Distance of hinge axis to residue i in
(A) Distance of hinge axis to residue i in
(A) Change in
(deg) Change in
(deg) Angle of psi(i) axis to hinge axis
(deg) Angle of psi(i) axis to hinge axis
(deg) Percentage Progress
ILE-505
ALA-506
5.5
6.6
-174.7
75.4
76.5
110.6
16.5
ALA-506
TRP-507
3.9
2.9
23.2
18.2
28.7
90.2
36.0
TRP-507
GLU-508
3.5
3.0
5.1
106.5
94.7
72.6
18.5
GLU-508
PHE-509
5.3
5.4
135.7
138.5
18.9
45.2
-104.0
PHE-509
ILE-510
5.5
5.2
21.7
-15.8
49.2
84.0
-3.6
ILE-510
ASP-511
6.9
8.0
150.9
-100.0
46.3
55.0
24.0
ASP-511
PHE-512
8.7
7.5
35.9
6.7
22.9
23.8
57.0
PHE-512
GLY-513
7.6
7.0
-17.8
-122.7
127.4
122.8
-51.4
GLY-513
MET-514
10.4
10.1
1.3
33.1
29.5
114.4
67.2
MET-514
ASP-515
8.9
12.0
173.8
87.4
100.0
50.2
163.9
ASP-515
LEU-516
11.5
14.1
-144.5
56.6
138.8
137.5
-122.0
LEU-516
GLN-517
13.7
13.4
-38.5
-34.5
74.6
81.5
19.3

Graph shows rotational transition at bending residues and can be used
to identify hinge bending residues.
Probably only informative for interdomain rotations greater than 20 degrees
Residue
iResidue
i+1Distance of hinge axis to residue i in
(A) Distance of hinge axis to residue i in
(A) Change in
(deg) Change in
(deg) Angle of psi(i) axis to hinge axis
(deg) Angle of psi(i) axis to hinge axis
(deg) Percentage Progress
GLN-692
CYS-693
7.5
6.8
19.3
-29.6
70.5
76.8
4.9
CYS-693
ASN-694
7.2
6.4
-6.1
39.6
110.3
101.9
16.4
ASN-694
GLY-695
3.6
2.9
-36.6
47.9
157.8
159.9
16.4
GLY-695
VAL-696
3.7
2.7
-40.0
-13.5
96.7
115.9
-14.2
VAL-696
LEU-697
3.6
1.8
16.0
-20.7
44.1
63.2
-0.7
LEU-697
GLU-698
6.8
5.3
22.8
-21.2
20.1
34.6
1.1
GLU-698
GLY-699
5.3
5.0
22.5
-27.3
80.9
43.1
1.4
GLY-699
ILE-700
2.7
1.9
-7.2
23.0
104.6
117.2
13.8
ILE-700
ARG-701
6.4
5.1
-5.1
-17.5
150.0
129.0
-21.2
ARG-701
ILE-702
7.5
7.0
13.8
-1.0
37.2
33.9
12.9
ILE-702
CYS-703
5.2
4.5
-6.4
-17.8
90.7
131.6
-14.5
CYS-703
ARG-704
7.6
4.1
18.9
21.6
66.6
69.9
19.1
ARG-704
LYS-705
10.2
7.8
6.6
15.4
24.6
24.5
27.7
LYS-705
GLY-706
8.6
7.6
20.8
-1.6
44.6
40.3
21.9
GLY-706
PHE-707
6.5
6.1
24.4
0.6
88.9
94.8
1.3
PHE-707
PRO-708
8.3
8.4
6.6
9.6
114.6
133.2
-12.9

Graph shows rotational transition at bending residues and can be used
to identify hinge bending residues.
Probably only informative for interdomain rotations greater than 20 degrees