Actin-Related Protein 3
(All numbering and residues are taken from first PDB file)
![]()
![]()
Bending Residue Dihedral Analysis
Residue
iResidue
i+1Distance of hinge axis to residue i in
(A) Distance of hinge axis to residue i in
(A) Change in
(deg) Change in
(deg) Angle of psi(i) axis to hinge axis
(deg) Angle of psi(i) axis to hinge axis
(deg) Percentage Progress
GLY-13
THR-14
18.4
17.9
6.6
-22.8
82.4
82.8
133.7
THR-14
GLY-15
21.3
21.1
31.3
-30.6
147.4
140.1
-0.4
GLY-15
TYR-16
21.8
21.7
18.7
-9.1
147.7
150.0
-182.1
TYR-16
THR-17
19.6
19.3
-10.1
-0.6
99.9
103.0
-142.6
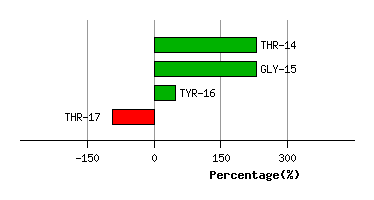
Graph shows rotational transition at bending residues and can be used
to identify hinge bending residues.
Probably only informative for interdomain rotations greater than 20 degrees
Residue
iResidue
i+1Distance of hinge axis to residue i in
(A) Distance of hinge axis to residue i in
(A) Change in
(deg) Change in
(deg) Angle of psi(i) axis to hinge axis
(deg) Angle of psi(i) axis to hinge axis
(deg) Percentage Progress
ILE-31
PRO-32
20.5
20.4
9.3
1.5
26.6
31.8
222.1
PRO-32
SER-33
22.8
22.9
-8.5
12.7
119.9
122.3
13.4
SER-33
CYS-34
23.5
23.4
0.7
-10.1
77.7
81.9
-77.8
CYS-34
ILE-35
27.2
27.1
-11.3
14.0
56.8
55.9
-92.2

Graph shows rotational transition at bending residues and can be used
to identify hinge bending residues.
Probably only informative for interdomain rotations greater than 20 degrees
Residue
iResidue
i+1Distance of hinge axis to residue i in
(A) Distance of hinge axis to residue i in
(A) Change in
(deg) Change in
(deg) Angle of psi(i) axis to hinge axis
(deg) Angle of psi(i) axis to hinge axis
(deg) Percentage Progress
LYS-75
TRP-76
32.0
31.9
-1.4
-2.5
96.7
94.2
-43.6
TRP-76
PRO-77
28.6
28.4
-10.8
24.6
140.8
142.7
183.9
PRO-77
ILE-78
27.8
27.6
-29.1
31.6
130.0
130.1
68.5

Graph shows rotational transition at bending residues and can be used
to identify hinge bending residues.
Probably only informative for interdomain rotations greater than 20 degrees
Residue
iResidue
i+1Distance of hinge axis to residue i in
(A) Distance of hinge axis to residue i in
(A) Change in
(deg) Change in
(deg) Angle of psi(i) axis to hinge axis
(deg) Angle of psi(i) axis to hinge axis
(deg) Percentage Progress
GLY-81
ILE-82
19.6
20.0
-18.9
16.9
74.3
70.3
72.5
ILE-82
VAL-83
21.8
21.9
-7.4
1.5
117.9
119.6
-65.3
VAL-83
GLU-84
24.7
24.6
-11.6
21.7
53.7
57.9
-103.3
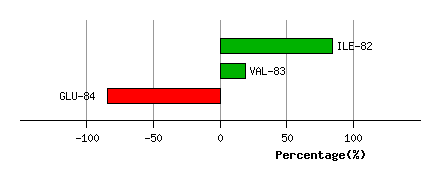
Graph shows rotational transition at bending residues and can be used
to identify hinge bending residues.
Probably only informative for interdomain rotations greater than 20 degrees
Residue
iResidue
i+1Distance of hinge axis to residue i in
(A) Distance of hinge axis to residue i in
(A) Change in
(deg) Change in
(deg) Angle of psi(i) axis to hinge axis
(deg) Angle of psi(i) axis to hinge axis
(deg) Percentage Progress
LEU-111
LEU-112
16.1
16.2
-6.8
2.8
97.0
96.8
112.7
LEU-112
THR-113
16.7
16.8
-17.9
24.6
132.5
133.4
69.4
THR-113
GLU-114
14.7
14.6
5.2
4.1
44.4
44.6
252.8

Graph shows rotational transition at bending residues and can be used
to identify hinge bending residues.
Probably only informative for interdomain rotations greater than 20 degrees
Residue
iResidue
i+1Distance of hinge axis to residue i in
(A) Distance of hinge axis to residue i in
(A) Change in
(deg) Change in
(deg) Angle of psi(i) axis to hinge axis
(deg) Angle of psi(i) axis to hinge axis
(deg) Percentage Progress
LEU-117
ASN-118
15.2
15.4
-3.0
13.4
112.7
107.2
170.0
ASN-118
THR-119
17.8
17.9
-3.6
4.7
48.6
49.0
66.8
THR-119
PRO-120
19.8
19.9
7.1
-11.5
67.0
69.1
-74.1

Graph shows rotational transition at bending residues and can be used
to identify hinge bending residues.
Probably only informative for interdomain rotations greater than 20 degrees
Residue
iResidue
i+1Distance of hinge axis to residue i in
(A) Distance of hinge axis to residue i in
(A) Change in
(deg) Change in
(deg) Angle of psi(i) axis to hinge axis
(deg) Angle of psi(i) axis to hinge axis
(deg) Percentage Progress
ALA-142
VAL-143
12.5
12.8
2.0
-4.7
67.8
65.7
-46.3
VAL-143
GLN-144
10.9
11.0
-17.4
15.8
52.0
55.9
114.9
GLN-144
ALA-145
10.1
10.1
-4.1
6.1
98.6
101.9
35.9
ALA-145
VAL-146
7.3
7.3
-8.4
9.2
81.6
77.5
25.1
VAL-146
LEU-147
5.6
5.4
-5.6
4.9
16.3
12.1
-67.3

Graph shows rotational transition at bending residues and can be used
to identify hinge bending residues.
Probably only informative for interdomain rotations greater than 20 degrees
Residue
iResidue
i+1Distance of hinge axis to residue i in
(A) Distance of hinge axis to residue i in
(A) Change in
(deg) Change in
(deg) Angle of psi(i) axis to hinge axis
(deg) Angle of psi(i) axis to hinge axis
(deg) Percentage Progress
HIS-370
HIS-371
7.6
7.5
0.1
4.1
44.9
43.1
-137.5
HIS-371
MET-372
7.0
7.2
-15.2
25.0
85.9
84.3
-111.0
MET-372
GLN-373
5.3
5.3
-14.3
4.0
40.7
45.6
208.3
GLN-373
ARG-374
8.0
8.1
1.9
-3.5
87.4
83.8
-68.8
ARG-374
TYR-375
10.7
10.9
11.8
-6.1
103.2
101.8
-105.4
TYR-375
ALA-376
9.4
9.5
-11.4
6.8
64.9
60.9
80.1
ALA-376
VAL-377
6.4
6.5
-3.1
-3.3
67.6
66.7
-18.8

Graph shows rotational transition at bending residues and can be used
to identify hinge bending residues.
Probably only informative for interdomain rotations greater than 20 degrees