Genome Polyprotein
(All numbering and residues are taken from first PDB file)
![]()
![]()
Bending Residue Dihedral Analysis
Residue
iResidue
i+1Distance of hinge axis to residue i in
(A) Distance of hinge axis to residue i in
(A) Change in
(deg) Change in
(deg) Angle of psi(i) axis to hinge axis
(deg) Angle of psi(i) axis to hinge axis
(deg) Percentage Progress
LYS-7
HIS-8
28.0
28.1
15.2
6.5
160.4
143.2
-449.2
HIS-8
VAL-9
30.2
30.4
1.6
1.0
84.1
81.8
240.4
VAL-9
LYS-10
30.8
30.9
8.4
-3.7
79.9
78.5
-36.7
LYS-10
ASP-11
34.6
34.6
-12.3
6.0
163.1
167.6
-122.0
ASP-11
VAL-12
34.5
34.4
7.4
11.3
50.8
57.6
215.3
VAL-12
GLY-13
33.1
32.7
-42.7
24.0
65.5
73.1
-45.4
GLY-13
LEU-14
35.3
34.9
0.0
2.2
131.2
130.2
-29.4
LEU-14
PRO-15
32.9
32.4
1.1
9.4
155.2
158.4
-268.4
PRO-15
SER-16
33.1
32.6
-3.3
-20.3
69.1
71.1
115.5
SER-16
ILE-17
30.6
30.4
-15.3
15.6
65.7
51.4
79.3
ILE-17
HIS-18
28.1
27.7
6.6
1.9
150.5
145.9
-166.5
HIS-18
THR-19
27.4
27.1
14.9
-12.6
103.8
105.7
81.3
THR-19
PRO-20
23.9
23.4
-2.5
-8.1
22.0
24.9
150.7
PRO-20
THR-21
22.2
21.9
0.3
14.2
93.7
90.3
53.4
THR-21
LYS-22
21.4
21.4
0.4
-12.8
145.1
137.6
157.4
LYS-22
THR-23
19.8
19.4
1.0
8.7
91.9
96.7
-76.0
THR-23
LYS-24
16.5
16.2
-0.2
-9.6
46.2
41.9
156.0
LYS-24
LEU-25
16.9
16.7
-1.1
2.3
59.6
57.7
-66.5

Graph shows rotational transition at bending residues and can be used
to identify hinge bending residues.
Probably only informative for interdomain rotations greater than 20 degrees
Residue
iResidue
i+1Distance of hinge axis to residue i in
(A) Distance of hinge axis to residue i in
(A) Change in
(deg) Change in
(deg) Angle of psi(i) axis to hinge axis
(deg) Angle of psi(i) axis to hinge axis
(deg) Percentage Progress
VAL-52
ASP-53
19.3
19.5
8.7
-1.9
102.6
91.3
-105.1
ASP-53
PHE-54
21.0
20.9
13.7
6.1
101.0
99.3
-171.6
PHE-54
ASP-55
19.0
18.8
-15.8
9.4
26.8
21.8
134.8
ASP-55
SER-56
19.8
20.0
10.0
6.2
133.8
134.5
-201.7
SER-56
ALA-57
18.7
19.2
-28.4
-0.5
101.2
84.2
69.0
ALA-57
LEU-58
15.5
15.5
6.1
13.9
105.2
99.0
-69.9
LEU-58
PHE-59
14.7
15.2
-11.9
-10.0
7.5
13.8
470.6
PHE-59
SER-60
15.7
16.0
45.2
-36.1
118.1
122.2
-86.4
SER-60
LYS-61
13.5
14.0
5.3
-8.5
110.6
118.4
104.2
LYS-61
TYR-62
10.7
10.8
15.7
16.1
173.4
171.4
-611.0
TYR-62
LYS-63
12.3
12.5
-20.3
64.1
69.0
60.4
-503.9
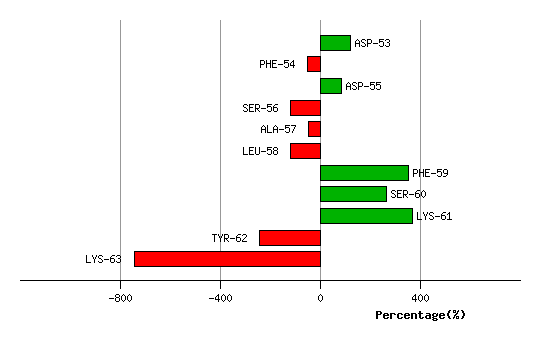
Graph shows rotational transition at bending residues and can be used
to identify hinge bending residues.
Probably only informative for interdomain rotations greater than 20 degrees
Residue
iResidue
i+1Distance of hinge axis to residue i in
(A) Distance of hinge axis to residue i in
(A) Change in
(deg) Change in
(deg) Angle of psi(i) axis to hinge axis
(deg) Angle of psi(i) axis to hinge axis
(deg) Percentage Progress
THR-390
PHE-391
16.2
15.9
21.2
-13.3
85.9
83.3
66.4
PHE-391
PRO-392
12.8
12.4
4.7
4.4
124.1
125.8
-95.3
PRO-392
VAL-393
10.2
9.9
-14.9
10.9
22.3
19.9
140.3
VAL-393
GLU-394
9.8
9.9
8.9
-1.0
102.6
101.9
2.6

Graph shows rotational transition at bending residues and can be used
to identify hinge bending residues.
Probably only informative for interdomain rotations greater than 20 degrees