Human Immunodeficiency Virus Protease
(All numbering and residues are taken from first PDB file)
![]()
![]()
Bending Residue Dihedral Analysis
Residue
iResidue
i+1Distance of hinge axis to residue i in
(A) Distance of hinge axis to residue i in
(A) Change in
(deg) Change in
(deg) Angle of psi(i) axis to hinge axis
(deg) Angle of psi(i) axis to hinge axis
(deg) Percentage Progress
ASP-30
THR-31
9.5
9.7
14.2
-7.0
13.3
15.0
53.3
THR-31
VAL-32
8.2
8.2
-4.1
-0.9
108.7
106.5
23.8
VAL-32
LEU-33
6.5
6.5
-5.2
14.7
157.5
161.5
69.9

Graph shows rotational transition at bending residues and can be used
to identify hinge bending residues.
Probably only informative for interdomain rotations greater than 20 degrees
Residue
iResidue
i+1Distance of hinge axis to residue i in
(A) Distance of hinge axis to residue i in
(A) Change in
(deg) Change in
(deg) Angle of psi(i) axis to hinge axis
(deg) Angle of psi(i) axis to hinge axis
(deg) Percentage Progress
TYR-59
ASP-60
3.0
2.6
-2.2
2.3
120.4
119.8
-195.6
ASP-60
GLN-61
5.0
4.8
-159.4
179.9
86.1
68.0
-162.7
GLN-61
ILE-62
8.7
8.5
-12.6
-18.9
20.4
14.5
350.9

Graph shows rotational transition at bending residues and can be used
to identify hinge bending residues.
Probably only informative for interdomain rotations greater than 20 degrees
Residue
iResidue
i+1Distance of hinge axis to residue i in
(A) Distance of hinge axis to residue i in
(A) Change in
(deg) Change in
(deg) Angle of psi(i) axis to hinge axis
(deg) Angle of psi(i) axis to hinge axis
(deg) Percentage Progress
GLY-73
THR-74
9.2
9.0
3.1
1.4
74.2
76.1
-78.0
THR-74
VAL-75
5.5
5.4
0.9
-5.6
28.3
27.1
-14.6
VAL-75
LEU-76
4.0
4.0
-6.2
0.4
84.8
89.3
89.9
LEU-76
VAL-77
2.8
3.0
4.2
-5.5
162.9
162.6
14.6
LEU-76
VAL-77
2.8
3.0
4.2
-5.5
162.9
162.6
14.6
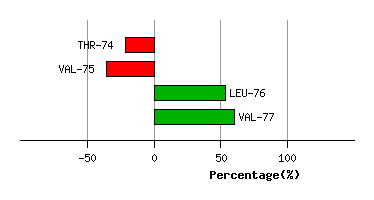
Graph shows rotational transition at bending residues and can be used
to identify hinge bending residues.
Probably only informative for interdomain rotations greater than 20 degrees
Residue
iResidue
i+1Distance of hinge axis to residue i in
(A) Distance of hinge axis to residue i in
(A) Change in
(deg) Change in
(deg) Angle of psi(i) axis to hinge axis
(deg) Angle of psi(i) axis to hinge axis
(deg) Percentage Progress
LEU-76
VAL-77
2.8
3.0
4.2
-5.5
162.9
162.6
14.6
LEU-76
VAL-77
2.8
3.0
4.2
-5.5
162.9
162.6
14.6
VAL-77
GLY-78
2.1
2.7
-2.7
5.7
83.1
84.0
-88.8
GLY-78
PRO-79
5.5
6.2
-9.3
-5.1
33.7
35.5
74.7
PRO-79
THR-80
8.0
8.9
18.5
-21.2
91.6
93.6
-47.5
THR-80
PRO-81
8.4
9.3
6.3
-4.6
164.1
168.0
-65.8
PRO-81
VAL-82
10.2
10.5
-28.8
31.9
76.3
74.5
97.9
VAL-82
ASN-83
9.5
9.7
7.0
-4.5
41.9
40.1
7.7
ASN-83
ILE-84
7.9
8.0
4.2
-3.2
61.8
59.7
49.1
ILE-84
ILE-85
10.5
10.4
1.9
-13.5
47.1
46.0
-22.3

Graph shows rotational transition at bending residues and can be used
to identify hinge bending residues.
Probably only informative for interdomain rotations greater than 20 degrees