Cell Division Protein Kinase 2
(All numbering and residues are taken from first PDB file)
![]()
![]()
Bending Residue Dihedral Analysis
Residue
iResidue
i+1Distance of hinge axis to residue i in
(A) Distance of hinge axis to residue i in
(A) Change in
(deg) Change in
(deg) Angle of psi(i) axis to hinge axis
(deg) Angle of psi(i) axis to hinge axis
(deg) Percentage Progress
PRO-45
SER-46
11.2
11.6
6.1
17.0
92.1
124.3
-22.9
SER-46
THR-47
8.7
10.1
-14.5
-18.4
113.1
120.6
-43.7
THR-47
ALA-48
7.0
9.6
-41.1
74.2
49.8
114.5
-18.8
ALA-48
ILE-49
5.2
7.1
19.0
-34.1
126.2
131.6
44.9
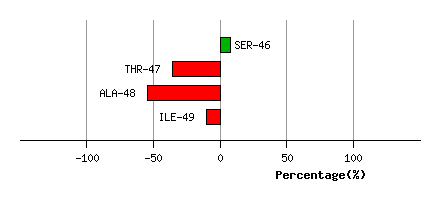
Graph shows rotational transition at bending residues and can be used
to identify hinge bending residues.
Probably only informative for interdomain rotations greater than 20 degrees
Residue
iResidue
i+1Distance of hinge axis to residue i in
(A) Distance of hinge axis to residue i in
(A) Change in
(deg) Change in
(deg) Angle of psi(i) axis to hinge axis
(deg) Angle of psi(i) axis to hinge axis
(deg) Percentage Progress
SER-53
LEU-54
2.6
1.0
38.0
-25.7
129.6
96.8
5.6
LEU-54
LEU-55
4.4
4.7
15.1
-0.4
91.3
137.1
-18.5
LEU-55
LYS-56
5.0
4.2
5.1
20.8
42.3
66.2
41.6
LYS-56
GLU-57
6.4
5.7
44.8
-56.4
104.2
79.8
-5.5
GLU-57
LEU-58
8.5
8.5
32.0
12.0
133.2
149.1
-72.3
LEU-58
ASN-59
9.3
9.2
-48.6
45.0
105.6
78.9
33.5
ASN-59
HIS-60
11.8
11.9
40.9
-21.7
122.9
128.8
-14.6

Graph shows rotational transition at bending residues and can be used
to identify hinge bending residues.
Probably only informative for interdomain rotations greater than 20 degrees
Residue
iResidue
i+1Distance of hinge axis to residue i in
(A) Distance of hinge axis to residue i in
(A) Change in
(deg) Change in
(deg) Angle of psi(i) axis to hinge axis
(deg) Angle of psi(i) axis to hinge axis
(deg) Percentage Progress
LYS-142
LEU-143
12.9
13.4
-24.8
26.1
111.0
105.7
14.6
LEU-143
ALA-144
9.1
9.7
-33.4
50.2
52.5
50.1
-27.6
ALA-144
ASP-145
7.0
8.4
-42.8
35.5
98.1
91.5
4.5
ASP-145
PHE-146
4.7
5.1
-43.7
17.2
90.6
98.1
-5.5
PHE-146
GLY-147
1.9
3.8
110.7
152.5
103.4
129.7
78.6
GLY-147
LEU-148
2.8
2.0
-9.3
60.7
116.0
85.4
65.7
LEU-148
ALA-149
3.2
1.9
-47.1
12.8
84.9
122.9
-21.0
ALA-149
ARG-150
3.3
3.8
-167.5
61.7
57.3
65.6
-218.9
ARG-150
ALA-151
6.9
5.8
160.7
6.2
85.4
151.8
327.6

Graph shows rotational transition at bending residues and can be used
to identify hinge bending residues.
Probably only informative for interdomain rotations greater than 20 degrees
Residue
iResidue
i+1Distance of hinge axis to residue i in
(A) Distance of hinge axis to residue i in
(A) Change in
(deg) Change in
(deg) Angle of psi(i) axis to hinge axis
(deg) Angle of psi(i) axis to hinge axis
(deg) Percentage Progress
LEU-166
TRP-167
5.3
4.9
1.4
-0.1
127.0
123.5
22.5
TRP-167
TYR-168
3.4
3.3
3.9
3.0
82.2
74.8
-1.7
TYR-168
ARG-169
0.2
1.5
-13.2
4.8
103.7
108.8
-9.6
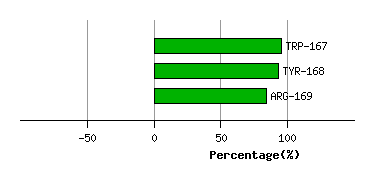
Graph shows rotational transition at bending residues and can be used
to identify hinge bending residues.
Probably only informative for interdomain rotations greater than 20 degrees