Bifunctional Udp-N-Acetylglucosamine 2-Epimerase/n- Acetylmannosamine Kinase
(All numbering and residues are taken from first PDB file)
![]()
![]()
Bending Residue Dihedral Analysis
Residue
iResidue
i+1Distance of hinge axis to residue i in
(A) Distance of hinge axis to residue i in
(A) Change in
(deg) Change in
(deg) Angle of psi(i) axis to hinge axis
(deg) Angle of psi(i) axis to hinge axis
(deg) Percentage Progress
ASP-515
ASN-516
7.6
7.8
-1.9
23.8
77.8
83.3
-118.0
ASN-516
ASP-517
7.3
7.1
-17.7
-8.2
16.3
11.5
248.7
ASP-517
GLY-518
8.5
8.8
4.3
-5.0
116.0
125.0
-57.3

Graph shows rotational transition at bending residues and can be used
to identify hinge bending residues.
Probably only informative for interdomain rotations greater than 20 degrees
Residue
iResidue
i+1Distance of hinge axis to residue i in
(A) Distance of hinge axis to residue i in
(A) Change in
(deg) Change in
(deg) Angle of psi(i) axis to hinge axis
(deg) Angle of psi(i) axis to hinge axis
(deg) Percentage Progress
GLU-525
ARG-526
2.0
2.1
9.2
-9.4
84.8
80.8
44.2
ARG-526
LYS-527
3.7
3.4
2.1
0.2
58.7
56.2
2.6
LYS-527
PHE-528
6.6
6.3
11.9
-9.1
23.0
23.3
47.0
PHE-528
GLY-529
6.0
5.8
-2.5
-10.1
115.5
115.1
-70.3
GLY-529
GLN-530
2.6
2.4
-1.5
2.0
105.0
101.5
2.6
GLN-530
GLY-531
1.2
1.4
-15.5
9.6
45.8
49.8
33.9
GLY-531
LYS-532
2.9
2.6
10.3
-15.9
79.6
81.6
9.7
LYS-532
GLY-533
5.4
4.7
3.7
-10.0
96.3
97.8
4.8
LYS-532
GLY-533
5.4
4.7
3.7
-10.0
96.3
97.8
4.8
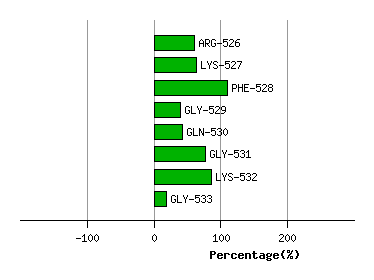
Graph shows rotational transition at bending residues and can be used
to identify hinge bending residues.
Probably only informative for interdomain rotations greater than 20 degrees
Residue
iResidue
i+1Distance of hinge axis to residue i in
(A) Distance of hinge axis to residue i in
(A) Change in
(deg) Change in
(deg) Angle of psi(i) axis to hinge axis
(deg) Angle of psi(i) axis to hinge axis
(deg) Percentage Progress
LYS-532
GLY-533
5.4
4.7
3.7
-10.0
96.3
97.8
4.8
LYS-532
GLY-533
5.4
4.7
3.7
-10.0
96.3
97.8
4.8
GLY-533
LEU-534
8.7
8.1
46.2
-41.1
46.5
63.8
23.9
LEU-534
GLU-535
8.3
8.0
3.7
12.3
19.2
18.6
36.1

Graph shows rotational transition at bending residues and can be used
to identify hinge bending residues.
Probably only informative for interdomain rotations greater than 20 degrees
Residue
iResidue
i+1Distance of hinge axis to residue i in
(A) Distance of hinge axis to residue i in
(A) Change in
(deg) Change in
(deg) Angle of psi(i) axis to hinge axis
(deg) Angle of psi(i) axis to hinge axis
(deg) Percentage Progress
LEU-556
ILE-557
4.4
4.0
-3.0
-1.4
37.5
35.0
29.2
ILE-557
HIS-558
4.8
4.5
7.6
-11.1
124.6
124.1
43.9
HIS-558
GLY-559
2.7
2.2
17.8
-13.2
141.8
142.9
-39.3
GLY-559
SER-560
3.9
4.2
7.8
-2.7
151.0
150.5
-50.4
SER-560
SER-561
4.6
4.9
20.6
-39.1
114.8
118.7
21.5
SER-561
PHE-562
1.2
1.3
10.5
-7.1
44.4
49.6
13.5
PHE-562
CYS-563
0.8
0.6
45.4
-21.3
123.1
105.0
-76.8
PHE-562
CYS-563
0.8
0.6
45.4
-21.3
123.1
105.0
-76.8

Graph shows rotational transition at bending residues and can be used
to identify hinge bending residues.
Probably only informative for interdomain rotations greater than 20 degrees
Residue
iResidue
i+1Distance of hinge axis to residue i in
(A) Distance of hinge axis to residue i in
(A) Change in
(deg) Change in
(deg) Angle of psi(i) axis to hinge axis
(deg) Angle of psi(i) axis to hinge axis
(deg) Percentage Progress
PHE-562
CYS-563
0.8
0.6
45.4
-21.3
123.1
105.0
-76.8
PHE-562
CYS-563
0.8
0.6
45.4
-21.3
123.1
105.0
-76.8
CYS-563
ALA-564
3.1
3.8
-41.1
13.4
61.6
44.9
123.9
ALA-564
ALA-565
3.9
4.4
-11.6
5.9
37.1
41.1
23.4

Graph shows rotational transition at bending residues and can be used
to identify hinge bending residues.
Probably only informative for interdomain rotations greater than 20 degrees
Residue
iResidue
i+1Distance of hinge axis to residue i in
(A) Distance of hinge axis to residue i in
(A) Change in
(deg) Change in
(deg) Angle of psi(i) axis to hinge axis
(deg) Angle of psi(i) axis to hinge axis
(deg) Percentage Progress
SER-699
ASP-700
6.9
7.4
-7.2
5.6
136.9
143.4
-35.6
ASP-700
LEU-701
7.1
7.0
21.0
-23.9
113.1
108.9
126.5
LEU-701
VAL-702
7.9
8.2
8.6
27.2
105.4
103.8
18.6

Graph shows rotational transition at bending residues and can be used
to identify hinge bending residues.
Probably only informative for interdomain rotations greater than 20 degrees