Sucrose Isomerase
(All numbering and residues are taken from first PDB file)
![]()
![]()
Bending Residue Dihedral Analysis
Residue
iResidue
i+1Distance of hinge axis to residue i in
(A) Distance of hinge axis to residue i in
(A) Change in
(deg) Change in
(deg) Angle of psi(i) axis to hinge axis
(deg) Angle of psi(i) axis to hinge axis
(deg) Percentage Progress
PRO-53
HIS-54
3.7
4.0
5.5
-0.2
27.6
27.2
47.0
HIS-54
TYR-55
1.3
1.8
-3.0
6.4
128.3
129.7
-4.0
TYR-55
ALA-56
3.5
3.5
1.0
3.7
38.3
39.4
51.2

Graph shows rotational transition at bending residues and can be used
to identify hinge bending residues.
Probably only informative for interdomain rotations greater than 20 degrees
Residue
iResidue
i+1Distance of hinge axis to residue i in
(A) Distance of hinge axis to residue i in
(A) Change in
(deg) Change in
(deg) Angle of psi(i) axis to hinge axis
(deg) Angle of psi(i) axis to hinge axis
(deg) Percentage Progress
ARG-70
GLU-71
9.0
8.7
-2.6
3.1
39.2
41.5
-7.5
GLU-71
VAL-72
6.2
5.9
-6.8
8.1
111.5
112.2
17.5
VAL-72
MET-73
2.5
2.1
-4.9
2.6
63.2
58.1
62.8
MET-73
LYS-74
2.3
2.5
14.8
-2.4
145.5
145.2
-66.9
LYS-74
GLU-75
2.1
2.6
-8.5
7.4
89.2
92.9
-31.5
GLU-75
TYR-76
5.4
5.8
-9.5
11.2
117.8
121.2
41.5
TYR-76
GLY-77
5.0
5.0
-18.3
16.5
63.6
63.9
38.6
GLY-77
THR-78
4.4
4.5
3.7
3.5
95.7
98.1
-31.0

Graph shows rotational transition at bending residues and can be used
to identify hinge bending residues.
Probably only informative for interdomain rotations greater than 20 degrees
Residue
iResidue
i+1Distance of hinge axis to residue i in
(A) Distance of hinge axis to residue i in
(A) Change in
(deg) Change in
(deg) Angle of psi(i) axis to hinge axis
(deg) Angle of psi(i) axis to hinge axis
(deg) Percentage Progress
LEU-96
MET-97
7.8
7.6
-2.0
0.8
61.9
60.9
-2.8
MET-97
VAL-98
4.3
4.1
-14.7
19.2
135.9
136.8
27.3
VAL-98
ASP-99
1.4
1.5
1.4
-16.5
116.8
112.9
125.3
ASP-99
VAL-100
2.5
2.4
-11.8
7.0
107.0
107.5
-80.5
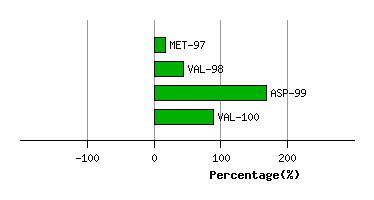
Graph shows rotational transition at bending residues and can be used
to identify hinge bending residues.
Probably only informative for interdomain rotations greater than 20 degrees
Residue
iResidue
i+1Distance of hinge axis to residue i in
(A) Distance of hinge axis to residue i in
(A) Change in
(deg) Change in
(deg) Angle of psi(i) axis to hinge axis
(deg) Angle of psi(i) axis to hinge axis
(deg) Percentage Progress
ASP-275
MET-276
4.6
4.4
-2.0
9.9
108.3
109.9
22.1
MET-276
ALA-277
1.1
1.0
-14.7
0.3
68.3
74.5
11.3
ALA-277
PHE-278
3.7
4.2
-4.6
12.4
61.8
68.4
9.3
PHE-278
THR-279
6.1
6.7
-4.1
14.4
108.1
113.2
54.9
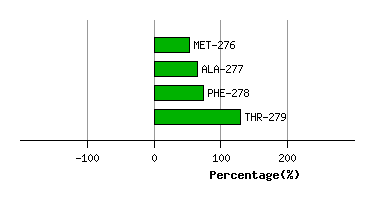
Graph shows rotational transition at bending residues and can be used
to identify hinge bending residues.
Probably only informative for interdomain rotations greater than 20 degrees