Nickel-Binding Periplasmic Protein
(All numbering and residues are taken from first PDB file)
![]()
![]()
Bending Residue Dihedral Analysis
Residue
iResidue
i+1Distance of hinge axis to residue i in
(A) Distance of hinge axis to residue i in
(A) Change in
(deg) Change in
(deg) Angle of psi(i) axis to hinge axis
(deg) Angle of psi(i) axis to hinge axis
(deg) Percentage Progress
LEU-37
VAL-38
8.4
8.3
0.8
1.5
58.3
59.5
27.8
VAL-38
LYS-39
9.8
9.6
1.7
-0.9
22.3
23.1
-1.1
LYS-39
TYR-40
9.7
9.5
-1.0
3.5
118.5
118.2
31.0

Graph shows rotational transition at bending residues and can be used
to identify hinge bending residues.
Probably only informative for interdomain rotations greater than 20 degrees
Residue
iResidue
i+1Distance of hinge axis to residue i in
(A) Distance of hinge axis to residue i in
(A) Change in
(deg) Change in
(deg) Angle of psi(i) axis to hinge axis
(deg) Angle of psi(i) axis to hinge axis
(deg) Percentage Progress
SER-45
VAL-46
15.0
14.8
8.3
-7.6
79.6
79.8
42.3
VAL-46
ILE-47
12.8
12.8
0.1
7.6
77.1
78.7
91.5
ILE-47
PRO-48
14.6
14.4
0.4
-0.9
48.0
46.1
23.1

Graph shows rotational transition at bending residues and can be used
to identify hinge bending residues.
Probably only informative for interdomain rotations greater than 20 degrees
Residue
iResidue
i+1Distance of hinge axis to residue i in
(A) Distance of hinge axis to residue i in
(A) Change in
(deg) Change in
(deg) Angle of psi(i) axis to hinge axis
(deg) Angle of psi(i) axis to hinge axis
(deg) Percentage Progress
PRO-200
ASP-201
15.4
15.4
-2.8
5.0
136.9
138.6
85.0
ASP-201
PRO-202
15.1
15.0
-0.2
-0.1
116.5
110.2
-36.0
PRO-202
THR-203
11.8
11.6
2.8
-5.3
22.0
23.5
-19.9

Graph shows rotational transition at bending residues and can be used
to identify hinge bending residues.
Probably only informative for interdomain rotations greater than 20 degrees
Residue
iResidue
i+1Distance of hinge axis to residue i in
(A) Distance of hinge axis to residue i in
(A) Change in
(deg) Change in
(deg) Angle of psi(i) axis to hinge axis
(deg) Angle of psi(i) axis to hinge axis
(deg) Percentage Progress
ILE-214
ASP-215
13.6
13.5
-3.9
8.4
68.0
71.0
3.5
ASP-215
LEU-216
12.2
12.1
-2.2
0.1
103.4
100.1
18.2
LEU-216
LEU-217
8.8
8.8
1.7
0.8
74.4
75.1
3.3
LEU-217
TYR-218
6.1
6.0
1.8
0.7
65.8
65.6
-22.2
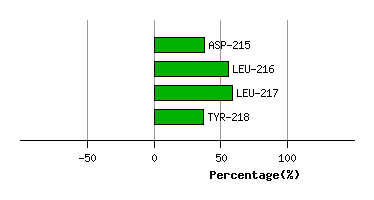
Graph shows rotational transition at bending residues and can be used
to identify hinge bending residues.
Probably only informative for interdomain rotations greater than 20 degrees
Residue
iResidue
i+1Distance of hinge axis to residue i in
(A) Distance of hinge axis to residue i in
(A) Change in
(deg) Change in
(deg) Angle of psi(i) axis to hinge axis
(deg) Angle of psi(i) axis to hinge axis
(deg) Percentage Progress
THR-490
GLU-491
1.8
2.0
1.6
1.2
88.3
87.5
17.6
GLU-491
ILE-492
2.1
1.9
-2.2
0.1
23.1
23.2
42.6
ILE-492
PRO-493
4.5
4.4
2.3
-0.9
76.7
77.9
23.0

Graph shows rotational transition at bending residues and can be used
to identify hinge bending residues.
Probably only informative for interdomain rotations greater than 20 degrees