Pyruvate Kinase
(All numbering and residues are taken from first PDB file)
![]()
![]()
Bending Residue Dihedral Analysis
Residue
iResidue
i+1Distance of hinge axis to residue i in
(A) Distance of hinge axis to residue i in
(A) Change in
(deg) Change in
(deg) Angle of psi(i) axis to hinge axis
(deg) Angle of psi(i) axis to hinge axis
(deg) Percentage Progress
THR-67
LYS-68
9.9
9.8
12.1
-7.5
99.6
98.3
-121.4
LYS-68
GLY-69
11.1
11.3
-1.3
-0.4
79.8
78.7
-208.0
GLY-69
PRO-70
8.3
8.5
9.2
-2.6
70.6
71.8
165.8
PRO-70
GLU-71
9.5
9.5
-10.5
-0.2
55.0
50.8
200.2

Graph shows rotational transition at bending residues and can be used
to identify hinge bending residues.
Probably only informative for interdomain rotations greater than 20 degrees
Residue
iResidue
i+1Distance of hinge axis to residue i in
(A) Distance of hinge axis to residue i in
(A) Change in
(deg) Change in
(deg) Angle of psi(i) axis to hinge axis
(deg) Angle of psi(i) axis to hinge axis
(deg) Percentage Progress
ILE-72
ARG-73
16.0
16.1
17.7
-15.1
86.4
82.2
21.3
ARG-73
THR-74
19.2
19.3
-10.6
5.3
65.9
66.4
143.9
THR-74
MET-75
22.9
22.9
5.1
-8.1
139.5
139.2
30.5
MET-75
LYS-76
24.4
24.2
7.1
4.5
89.1
89.9
-59.5

Graph shows rotational transition at bending residues and can be used
to identify hinge bending residues.
Probably only informative for interdomain rotations greater than 20 degrees
Residue
iResidue
i+1Distance of hinge axis to residue i in
(A) Distance of hinge axis to residue i in
(A) Change in
(deg) Change in
(deg) Angle of psi(i) axis to hinge axis
(deg) Angle of psi(i) axis to hinge axis
(deg) Percentage Progress
LYS-156
GLY-157
23.1
23.0
-7.1
-7.9
97.7
97.4
-107.9
GLY-157
VAL-158
19.7
19.6
3.2
7.8
66.2
63.6
12.2
VAL-158
ASN-159
19.2
19.0
-19.1
29.9
123.5
127.0
231.7
ASN-159
LEU-160
17.2
17.3
-9.8
10.1
108.3
102.4
67.7
LEU-160
PRO-161
17.8
17.8
-9.4
7.2
134.9
142.8
-182.3
PRO-161
GLY-162
16.4
16.4
-1.5
-6.4
94.5
92.6
-52.6
GLY-162
VAL-163
15.5
15.6
17.7
-18.7
152.3
152.6
178.8
GLY-162
VAL-163
15.5
15.6
17.7
-18.7
152.3
152.6
178.8

Graph shows rotational transition at bending residues and can be used
to identify hinge bending residues.
Probably only informative for interdomain rotations greater than 20 degrees
Residue
iResidue
i+1Distance of hinge axis to residue i in
(A) Distance of hinge axis to residue i in
(A) Change in
(deg) Change in
(deg) Angle of psi(i) axis to hinge axis
(deg) Angle of psi(i) axis to hinge axis
(deg) Percentage Progress
GLY-162
VAL-163
15.5
15.6
17.7
-18.7
152.3
152.6
178.8
GLY-162
VAL-163
15.5
15.6
17.7
-18.7
152.3
152.6
178.8
VAL-163
SER-164
16.0
16.0
4.9
-9.6
113.6
111.8
-119.8
SER-164
ILE-165
13.8
13.7
-13.4
9.7
27.2
19.7
16.6
ILE-165
ALA-166
13.2
13.2
7.5
-10.6
133.6
129.8
99.2
ALA-166
LEU-167
12.5
12.2
10.3
3.1
127.7
128.3
-218.8
LEU-167
PRO-168
10.3
10.2
3.4
-12.7
91.6
96.3
-104.2
LEU-167
PRO-168
10.3
10.2
3.4
-12.7
91.6
96.3
-104.2

Graph shows rotational transition at bending residues and can be used
to identify hinge bending residues.
Probably only informative for interdomain rotations greater than 20 degrees
Residue
iResidue
i+1Distance of hinge axis to residue i in
(A) Distance of hinge axis to residue i in
(A) Change in
(deg) Change in
(deg) Angle of psi(i) axis to hinge axis
(deg) Angle of psi(i) axis to hinge axis
(deg) Percentage Progress
LEU-167
PRO-168
10.3
10.2
3.4
-12.7
91.6
96.3
-104.2
LEU-167
PRO-168
10.3
10.2
3.4
-12.7
91.6
96.3
-104.2
PRO-168
ALA-169
6.9
6.8
-16.2
40.0
134.0
128.7
237.6
ALA-169
LEU-170
3.7
3.5
14.9
-36.9
107.5
106.3
-25.8
LEU-170
ALA-171
3.4
3.9
-13.5
13.9
51.8
44.8
-57.6
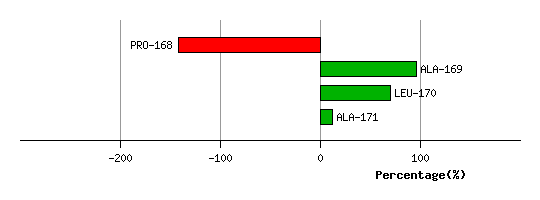
Graph shows rotational transition at bending residues and can be used
to identify hinge bending residues.
Probably only informative for interdomain rotations greater than 20 degrees