Succinyl-Coa Ligase [Gdp-Forming] Beta-Chain, Mitochondrial
(All numbering and residues are taken from first PDB file)
![]()
![]()
Bending Residue Dihedral Analysis
Residue
iResidue
i+1Distance of hinge axis to residue i in
(A) Distance of hinge axis to residue i in
(A) Change in
(deg) Change in
(deg) Angle of psi(i) axis to hinge axis
(deg) Angle of psi(i) axis to hinge axis
(deg) Percentage Progress
ILE-325
PHE-326
3.1
3.3
2.6
-9.3
117.3
120.3
8.3
PHE-326
GLY-327
5.3
5.2
-6.5
-8.9
122.2
115.3
-80.5
GLY-327
GLY-328
8.0
8.0
-163.9
159.9
67.8
59.8
89.0
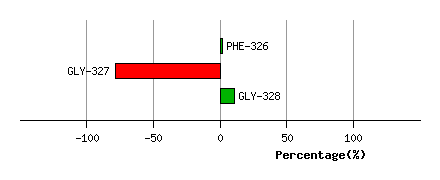
Graph shows rotational transition at bending residues and can be used
to identify hinge bending residues.
Probably only informative for interdomain rotations greater than 20 degrees
Residue
iResidue
i+1Distance of hinge axis to residue i in
(A) Distance of hinge axis to residue i in
(A) Change in
(deg) Change in
(deg) Angle of psi(i) axis to hinge axis
(deg) Angle of psi(i) axis to hinge axis
(deg) Percentage Progress
CYS-343
ARG-344
5.5
5.3
-10.3
-1.8
26.4
17.8
83.0
ARG-344
GLU-345
4.9
4.8
16.6
-14.4
121.5
120.4
-18.4
GLU-345
LEU-346
6.1
6.1
-10.3
-2.4
108.1
104.1
11.9

Graph shows rotational transition at bending residues and can be used
to identify hinge bending residues.
Probably only informative for interdomain rotations greater than 20 degrees
Residue
iResidue
i+1Distance of hinge axis to residue i in
(A) Distance of hinge axis to residue i in
(A) Change in
(deg) Change in
(deg) Angle of psi(i) axis to hinge axis
(deg) Angle of psi(i) axis to hinge axis
(deg) Percentage Progress
ARG-355
LEU-356
3.2
3.0
-1.8
2.0
97.8
95.6
-7.2
LEU-356
GLU-357
3.3
3.0
25.3
-21.6
130.4
134.0
-15.0
GLU-357
GLY-358
5.7
5.5
1.8
-25.2
82.5
85.2
41.9
GLY-358
THR-359
8.8
8.7
-28.3
48.8
115.1
132.6
156.7
THR-359
ASN-360
11.5
11.5
-0.4
-22.5
142.5
146.2
-123.6

Graph shows rotational transition at bending residues and can be used
to identify hinge bending residues.
Probably only informative for interdomain rotations greater than 20 degrees
Residue
iResidue
i+1Distance of hinge axis to residue i in
(A) Distance of hinge axis to residue i in
(A) Change in
(deg) Change in
(deg) Angle of psi(i) axis to hinge axis
(deg) Angle of psi(i) axis to hinge axis
(deg) Percentage Progress
ILE-375
THR-376
8.8
8.9
-25.2
52.8
123.9
145.9
157.5
THR-376
SER-377
9.9
10.1
-29.3
5.8
128.0
121.1
-87.5
SER-377
ALA-378
8.5
8.0
-27.1
30.9
163.5
160.8
76.6

Graph shows rotational transition at bending residues and can be used
to identify hinge bending residues.
Probably only informative for interdomain rotations greater than 20 degrees