Structural Polyprotein (P130)
(All numbering and residues are taken from first PDB file)
![]()
![]()
Bending Residue Dihedral Analysis
Residue
iResidue
i+1Distance of hinge axis to residue i in
(A) Distance of hinge axis to residue i in
(A) Change in
(deg) Change in
(deg) Angle of psi(i) axis to hinge axis
(deg) Angle of psi(i) axis to hinge axis
(deg) Percentage Progress
LEU-44
GLU-45
10.6
10.5
5.4
3.7
76.7
77.4
41.8
GLU-45
TYR-46
10.2
10.0
-8.6
4.2
139.8
143.4
-1.0
TYR-46
ILE-47
7.3
7.0
-11.4
2.7
91.4
84.0
-3.1
ILE-47
THR-48
3.8
3.4
5.2
7.9
86.3
81.6
-9.0
THR-48
CYS-49
2.7
2.0
7.3
-10.0
80.0
72.3
34.9

Graph shows rotational transition at bending residues and can be used
to identify hinge bending residues.
Probably only informative for interdomain rotations greater than 20 degrees
Residue
iResidue
i+1Distance of hinge axis to residue i in
(A) Distance of hinge axis to residue i in
(A) Change in
(deg) Change in
(deg) Angle of psi(i) axis to hinge axis
(deg) Angle of psi(i) axis to hinge axis
(deg) Percentage Progress
ASP-117
HIS-118
6.8
7.1
-2.1
8.6
101.5
106.3
12.8
HIS-118
ALA-119
3.4
3.9
-18.5
9.0
149.9
158.5
-45.9
ALA-119
SER-120
2.2
2.6
-24.8
9.8
81.6
86.2
25.9

Graph shows rotational transition at bending residues and can be used
to identify hinge bending residues.
Probably only informative for interdomain rotations greater than 20 degrees
Residue
iResidue
i+1Distance of hinge axis to residue i in
(A) Distance of hinge axis to residue i in
(A) Change in
(deg) Change in
(deg) Angle of psi(i) axis to hinge axis
(deg) Angle of psi(i) axis to hinge axis
(deg) Percentage Progress
ASP-188
PHE-189
7.2
6.2
-2.2
6.3
148.7
145.2
34.5
PHE-189
PRO-190
7.1
6.2
-4.8
7.2
107.4
106.4
-8.6
PRO-190
PRO-191
10.4
9.6
-0.5
-4.7
131.2
131.0
-27.7

Graph shows rotational transition at bending residues and can be used
to identify hinge bending residues.
Probably only informative for interdomain rotations greater than 20 degrees
Residue
iResidue
i+1Distance of hinge axis to residue i in
(A) Distance of hinge axis to residue i in
(A) Change in
(deg) Change in
(deg) Angle of psi(i) axis to hinge axis
(deg) Angle of psi(i) axis to hinge axis
(deg) Percentage Progress
LYS-254
ALA-255
9.6
8.7
-147.9
49.8
88.5
118.5
-122.0
ALA-255
PRO-256
12.0
8.9
50.8
-0.5
25.1
28.9
260.0
PRO-256
PHE-257
10.8
9.9
43.0
-0.2
88.5
93.3
-6.1
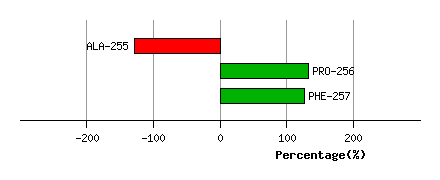
Graph shows rotational transition at bending residues and can be used
to identify hinge bending residues.
Probably only informative for interdomain rotations greater than 20 degrees