Casein Kinase II, Alpha Chain
(All numbering and residues are taken from first PDB file)
![]()
![]()
Bending Residue Dihedral Analysis
Residue
iResidue
i+1Distance of hinge axis to residue i in
(A) Distance of hinge axis to residue i in
(A) Change in
(deg) Change in
(deg) Angle of psi(i) axis to hinge axis
(deg) Angle of psi(i) axis to hinge axis
(deg) Percentage Progress
TYR-23
TRP-24
9.9
9.9
-5.1
4.6
92.4
89.1
-46.1
TRP-24
ASP-25
7.0
7.1
-1.3
-4.4
79.4
78.3
25.9
ASP-25
TYR-26
4.3
4.5
-21.8
26.1
149.3
147.3
105.2
TYR-26
GLU-27
2.3
2.9
-6.4
7.9
92.1
96.0
-28.8
TYR-26
GLU-27
2.3
2.9
-6.4
7.9
92.1
96.0
-28.8

Graph shows rotational transition at bending residues and can be used
to identify hinge bending residues.
Probably only informative for interdomain rotations greater than 20 degrees
Residue
iResidue
i+1Distance of hinge axis to residue i in
(A) Distance of hinge axis to residue i in
(A) Change in
(deg) Change in
(deg) Angle of psi(i) axis to hinge axis
(deg) Angle of psi(i) axis to hinge axis
(deg) Percentage Progress
TYR-26
GLU-27
2.3
2.9
-6.4
7.9
92.1
96.0
-28.8
TYR-26
GLU-27
2.3
2.9
-6.4
7.9
92.1
96.0
-28.8
GLU-27
ALA-28
2.7
2.8
-11.4
16.5
91.0
88.4
54.2
ALA-28
LEU-29
5.8
6.2
8.5
-18.1
151.7
154.3
241.7
LEU-29
THR-30
5.9
6.4
12.4
-2.7
61.7
65.1
5.2
LEU-29
THR-30
5.9
6.4
12.4
-2.7
61.7
65.1
5.2

Graph shows rotational transition at bending residues and can be used
to identify hinge bending residues.
Probably only informative for interdomain rotations greater than 20 degrees
Residue
iResidue
i+1Distance of hinge axis to residue i in
(A) Distance of hinge axis to residue i in
(A) Change in
(deg) Change in
(deg) Angle of psi(i) axis to hinge axis
(deg) Angle of psi(i) axis to hinge axis
(deg) Percentage Progress
LEU-29
THR-30
5.9
6.4
12.4
-2.7
61.7
65.1
5.2
LEU-29
THR-30
5.9
6.4
12.4
-2.7
61.7
65.1
5.2
THR-30
VAL-31
8.7
8.8
10.8
2.1
16.5
18.5
284.8
VAL-31
GLN-32
7.7
7.5
0.0
12.1
56.4
54.5
27.1

Graph shows rotational transition at bending residues and can be used
to identify hinge bending residues.
Probably only informative for interdomain rotations greater than 20 degrees
Residue
iResidue
i+1Distance of hinge axis to residue i in
(A) Distance of hinge axis to residue i in
(A) Change in
(deg) Change in
(deg) Angle of psi(i) axis to hinge axis
(deg) Angle of psi(i) axis to hinge axis
(deg) Percentage Progress
TYR-39
GLU-40
4.1
4.2
-5.5
-1.4
61.6
60.1
38.3
GLU-40
VAL-41
3.2
3.3
-4.8
10.3
91.3
89.2
68.1
VAL-41
VAL-42
4.0
3.8
-3.9
2.9
22.6
19.1
34.3
VAL-42
ARG-43
4.6
3.9
-2.7
16.3
88.3
88.0
-73.3
ARG-43
LYS-44
8.1
7.5
10.4
-13.5
27.9
23.3
-80.3

Graph shows rotational transition at bending residues and can be used
to identify hinge bending residues.
Probably only informative for interdomain rotations greater than 20 degrees
Residue
iResidue
i+1Distance of hinge axis to residue i in
(A) Distance of hinge axis to residue i in
(A) Change in
(deg) Change in
(deg) Angle of psi(i) axis to hinge axis
(deg) Angle of psi(i) axis to hinge axis
(deg) Percentage Progress
SER-51
GLU-52
10.5
10.7
-2.9
10.5
24.1
24.7
144.1
GLU-52
VAL-53
10.3
10.6
6.4
-7.5
108.4
107.7
-96.8
VAL-53
PHE-54
8.5
8.6
-4.8
3.5
8.8
9.4
4.1
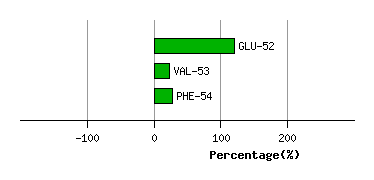
Graph shows rotational transition at bending residues and can be used
to identify hinge bending residues.
Probably only informative for interdomain rotations greater than 20 degrees
Residue
iResidue
i+1Distance of hinge axis to residue i in
(A) Distance of hinge axis to residue i in
(A) Change in
(deg) Change in
(deg) Angle of psi(i) axis to hinge axis
(deg) Angle of psi(i) axis to hinge axis
(deg) Percentage Progress
LYS-64
CYS-65
6.7
6.6
-10.2
16.3
2.1
2.2
-52.1
CYS-65
ILE-66
5.6
5.4
2.1
0.3
103.7
99.8
114.6
ILE-66
ILE-67
5.2
5.1
9.8
-13.7
121.9
123.3
43.0

Graph shows rotational transition at bending residues and can be used
to identify hinge bending residues.
Probably only informative for interdomain rotations greater than 20 degrees
Residue
iResidue
i+1Distance of hinge axis to residue i in
(A) Distance of hinge axis to residue i in
(A) Change in
(deg) Change in
(deg) Angle of psi(i) axis to hinge axis
(deg) Angle of psi(i) axis to hinge axis
(deg) Percentage Progress
ILE-78
LYS-79
3.9
3.8
8.0
5.6
74.2
73.2
1.5
LYS-79
ARG-80
1.4
1.3
1.9
-5.3
75.5
73.5
125.0
ARG-80
GLU-81
2.5
2.5
10.9
-7.2
141.8
142.7
-74.7

Graph shows rotational transition at bending residues and can be used
to identify hinge bending residues.
Probably only informative for interdomain rotations greater than 20 degrees
Residue
iResidue
i+1Distance of hinge axis to residue i in
(A) Distance of hinge axis to residue i in
(A) Change in
(deg) Change in
(deg) Angle of psi(i) axis to hinge axis
(deg) Angle of psi(i) axis to hinge axis
(deg) Percentage Progress
LEU-97
LEU-98
7.3
6.9
-8.0
8.8
112.7
114.7
55.6
LEU-98
ASP-99
7.7
7.3
4.6
-10.7
100.1
103.4
32.1
ASP-99
ILE-100
5.8
5.5
-4.5
4.3
64.1
64.6
-2.6
ILE-100
VAL-101
4.2
4.1
-0.5
-4.9
109.3
107.8
-6.7
VAL-101
ARG-102
6.0
6.2
5.5
-11.1
103.5
98.7
-94.3
ARG-102
ASP-103
8.3
8.5
-3.3
19.8
129.5
127.0
120.3
ASP-103
GLN-104
11.3
11.4
-7.2
2.9
57.8
60.1
5.4

Graph shows rotational transition at bending residues and can be used
to identify hinge bending residues.
Probably only informative for interdomain rotations greater than 20 degrees
Residue
iResidue
i+1Distance of hinge axis to residue i in
(A) Distance of hinge axis to residue i in
(A) Change in
(deg) Change in
(deg) Angle of psi(i) axis to hinge axis
(deg) Angle of psi(i) axis to hinge axis
(deg) Percentage Progress
SER-110
LEU-111
3.5
3.9
8.3
3.2
80.7
72.3
6.7
LEU-111
ILE-112
0.3
0.7
-7.7
-6.8
31.5
33.0
211.5
ILE-112
PHE-113
2.8
2.3
-1.2
-2.4
101.2
100.0
12.9

Graph shows rotational transition at bending residues and can be used
to identify hinge bending residues.
Probably only informative for interdomain rotations greater than 20 degrees