Glutamyl-Trna Synthetase
(All numbering and residues are taken from first PDB file)
![]()
![]()
Bending Residue Dihedral Analysis
Residue
iResidue
i+1Distance of hinge axis to residue i in
(A) Distance of hinge axis to residue i in
(A) Change in
(deg) Change in
(deg) Angle of psi(i) axis to hinge axis
(deg) Angle of psi(i) axis to hinge axis
(deg) Percentage Progress
GLY-260
PHE-261
8.3
8.4
7.4
11.7
65.4
62.4
49.3
PHE-261
LEU-262
6.4
6.5
5.0
-9.2
96.1
98.9
-33.0
LEU-262
PRO-263
7.8
8.1
4.2
8.3
26.2
25.2
72.0

Graph shows rotational transition at bending residues and can be used
to identify hinge bending residues.
Probably only informative for interdomain rotations greater than 20 degrees
Residue
iResidue
i+1Distance of hinge axis to residue i in
(A) Distance of hinge axis to residue i in
(A) Change in
(deg) Change in
(deg) Angle of psi(i) axis to hinge axis
(deg) Angle of psi(i) axis to hinge axis
(deg) Percentage Progress
GLU-264
ALA-265
10.3
10.6
3.6
-6.0
112.3
111.7
49.9
ALA-265
LEU-266
6.7
7.0
2.8
-1.6
158.1
151.6
-14.4
LEU-266
ARG-267
6.3
6.6
-5.4
7.8
45.4
46.2
-6.4
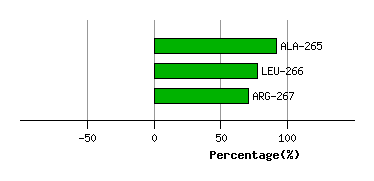
Graph shows rotational transition at bending residues and can be used
to identify hinge bending residues.
Probably only informative for interdomain rotations greater than 20 degrees
Residue
iResidue
i+1Distance of hinge axis to residue i in
(A) Distance of hinge axis to residue i in
(A) Change in
(deg) Change in
(deg) Angle of psi(i) axis to hinge axis
(deg) Angle of psi(i) axis to hinge axis
(deg) Percentage Progress
LEU-270
CYS-271
6.4
6.7
-0.6
8.4
115.8
114.8
58.3
CYS-271
LEU-272
9.3
9.4
-23.8
24.2
109.8
113.3
7.8
LEU-272
MET-273
7.9
7.7
-10.3
11.9
144.3
142.8
-22.4
MET-273
GLY-274
5.5
5.4
4.1
-35.8
37.9
45.0
-168.2
GLY-274
PHE-275
7.6
7.6
84.9
-53.3
100.6
103.3
43.4
PHE-275
SER-276
10.9
11.1
-37.1
36.2
36.2
43.6
50.2
SER-276
MET-277
13.1
13.3
-16.3
0.7
78.4
72.7
14.3

Graph shows rotational transition at bending residues and can be used
to identify hinge bending residues.
Probably only informative for interdomain rotations greater than 20 degrees
Residue
iResidue
i+1Distance of hinge axis to residue i in
(A) Distance of hinge axis to residue i in
(A) Change in
(deg) Change in
(deg) Angle of psi(i) axis to hinge axis
(deg) Angle of psi(i) axis to hinge axis
(deg) Percentage Progress
GLY-280
ARG-281
16.9
16.8
4.7
-5.1
145.5
139.0
22.5
ARG-281
GLU-282
15.6
15.2
-17.2
-3.4
104.6
102.5
8.0
GLU-282
ILE-283
11.8
11.4
36.5
-32.2
122.7
132.5
15.3
ILE-283
PHE-284
11.6
11.9
8.6
-72.3
86.7
89.8
-272.3
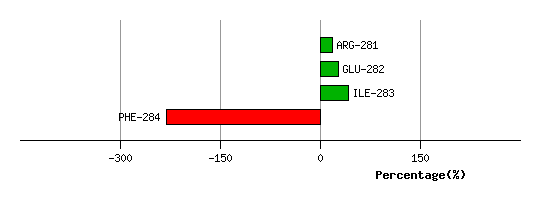
Graph shows rotational transition at bending residues and can be used
to identify hinge bending residues.
Probably only informative for interdomain rotations greater than 20 degrees
Residue
iResidue
i+1Distance of hinge axis to residue i in
(A) Distance of hinge axis to residue i in
(A) Change in
(deg) Change in
(deg) Angle of psi(i) axis to hinge axis
(deg) Angle of psi(i) axis to hinge axis
(deg) Percentage Progress
GLN-291
ALA-292
22.0
21.8
0.9
14.2
60.3
66.8
114.1
ALA-292
PHE-293
20.3
19.9
-20.7
21.5
151.5
156.1
27.5
PHE-293
THR-294
18.5
18.3
-22.9
7.0
146.9
150.4
-191.8
THR-294
TRP-295
19.1
18.6
-6.5
7.2
128.7
126.6
76.6

Graph shows rotational transition at bending residues and can be used
to identify hinge bending residues.
Probably only informative for interdomain rotations greater than 20 degrees
Residue
iResidue
i+1Distance of hinge axis to residue i in
(A) Distance of hinge axis to residue i in
(A) Change in
(deg) Change in
(deg) Angle of psi(i) axis to hinge axis
(deg) Angle of psi(i) axis to hinge axis
(deg) Percentage Progress
PHE-305
ASP-306
2.2
1.7
-31.4
5.9
49.8
54.1
88.1
ASP-306
LEU-307
3.9
3.8
22.1
-22.8
159.6
153.8
-12.2
LEU-307
GLU-308
4.5
4.0
6.1
-2.1
136.2
142.2
-57.8
GLU-308
LYS-309
5.7
5.5
7.7
-0.3
80.5
81.7
15.0
GLU-308
LYS-309
5.7
5.5
7.7
-0.3
80.5
81.7
15.0

Graph shows rotational transition at bending residues and can be used
to identify hinge bending residues.
Probably only informative for interdomain rotations greater than 20 degrees
Residue
iResidue
i+1Distance of hinge axis to residue i in
(A) Distance of hinge axis to residue i in
(A) Change in
(deg) Change in
(deg) Angle of psi(i) axis to hinge axis
(deg) Angle of psi(i) axis to hinge axis
(deg) Percentage Progress
GLU-308
LYS-309
5.7
5.5
7.7
-0.3
80.5
81.7
15.0
GLU-308
LYS-309
5.7
5.5
7.7
-0.3
80.5
81.7
15.0
LYS-309
LEU-310
4.3
4.0
-3.2
-2.4
113.1
115.4
7.4
LEU-310
ARG-311
0.6
0.5
3.0
-11.0
9.0
5.6
-102.2
ARG-311
TRP-312
2.0
1.6
7.8
-1.4
61.4
68.6
76.8
TRP-312
MET-313
4.1
4.1
1.5
-3.1
81.7
82.3
-2.1
TRP-312
MET-313
4.1
4.1
1.5
-3.1
81.7
82.3
-2.1

Graph shows rotational transition at bending residues and can be used
to identify hinge bending residues.
Probably only informative for interdomain rotations greater than 20 degrees
Residue
iResidue
i+1Distance of hinge axis to residue i in
(A) Distance of hinge axis to residue i in
(A) Change in
(deg) Change in
(deg) Angle of psi(i) axis to hinge axis
(deg) Angle of psi(i) axis to hinge axis
(deg) Percentage Progress
TRP-312
MET-313
4.1
4.1
1.5
-3.1
81.7
82.3
-2.1
TRP-312
MET-313
4.1
4.1
1.5
-3.1
81.7
82.3
-2.1
MET-313
ASN-314
4.1
4.2
-2.1
-3.6
134.5
135.9
5.8
ASN-314
GLY-315
2.4
2.8
5.7
-4.4
23.3
22.8
21.6

Graph shows rotational transition at bending residues and can be used
to identify hinge bending residues.
Probably only informative for interdomain rotations greater than 20 degrees
Residue
iResidue
i+1Distance of hinge axis to residue i in
(A) Distance of hinge axis to residue i in
(A) Change in
(deg) Change in
(deg) Angle of psi(i) axis to hinge axis
(deg) Angle of psi(i) axis to hinge axis
(deg) Percentage Progress
LYS-316
TYR-317
6.1
6.4
7.0
-1.1
109.8
107.9
4.5
TYR-317
ILE-318
6.8
7.1
13.6
-15.5
163.4
165.3
1.4
ILE-318
ARG-319
5.0
5.3
-4.6
-0.4
46.6
49.6
23.7
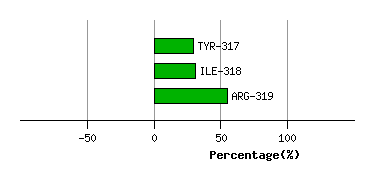
Graph shows rotational transition at bending residues and can be used
to identify hinge bending residues.
Probably only informative for interdomain rotations greater than 20 degrees