Eco Rv Endonuclease (E.C.3.1.21.4)
(All numbering and residues are taken from first PDB file)
![]()
![]()
Bending Residue Dihedral Analysis
Residue
iResidue
i+1Distance of hinge axis to residue i in
(A) Distance of hinge axis to residue i in
(A) Change in
(deg) Change in
(deg) Angle of psi(i) axis to hinge axis
(deg) Angle of psi(i) axis to hinge axis
(deg) Percentage Progress
ALA-10
LEU-11
10.1
11.0
21.4
23.8
22.4
38.1
215.4
LEU-11
TYR-12
8.2
8.2
-24.0
0.9
117.4
133.9
-74.8
TYR-12
ASP-13
11.1
11.1
-82.6
3.3
116.2
108.0
-104.3
ASP-13
GLU-14
14.4
12.9
-166.1
-85.1
114.9
56.0
3.2
GLU-14
ASN-15
16.5
15.0
100.4
-89.1
40.4
53.5
75.8
ASN-15
GLN-16
15.3
15.9
-111.9
77.4
81.5
125.2
-53.2
GLN-16
LYS-17
11.7
12.5
-178.2
-137.8
158.6
150.1
184.3
LYS-17
TYR-18
11.2
11.6
41.2
-4.7
65.2
66.4
49.8
TYR-18
ASP-19
8.0
8.2
44.0
-46.8
9.8
16.5
1.4
ASP-19
VAL-20
9.1
9.4
-25.1
-7.6
118.6
105.3
-67.5

Graph shows rotational transition at bending residues and can be used
to identify hinge bending residues.
Probably only informative for interdomain rotations greater than 20 degrees
Residue
iResidue
i+1Distance of hinge axis to residue i in
(A) Distance of hinge axis to residue i in
(A) Change in
(deg) Change in
(deg) Angle of psi(i) axis to hinge axis
(deg) Angle of psi(i) axis to hinge axis
(deg) Percentage Progress
PRO-32
LEU-33
7.9
8.3
11.2
-33.2
57.4
65.2
-84.6
LEU-33
GLY-34
6.0
6.2
-159.7
138.7
63.3
63.3
62.3
GLY-34
SER-35
4.7
5.1
10.3
29.8
58.9
33.0
142.8
SER-35
ASP-36
3.9
5.5
-91.2
111.0
124.9
125.0
36.2

Graph shows rotational transition at bending residues and can be used
to identify hinge bending residues.
Probably only informative for interdomain rotations greater than 20 degrees
Residue
iResidue
i+1Distance of hinge axis to residue i in
(A) Distance of hinge axis to residue i in
(A) Change in
(deg) Change in
(deg) Angle of psi(i) axis to hinge axis
(deg) Angle of psi(i) axis to hinge axis
(deg) Percentage Progress
THR-139
ARG-140
8.0
7.4
-4.1
-17.7
140.1
128.5
-97.4
ARG-140
VAL-141
6.3
5.4
0.6
9.2
31.0
21.0
90.2
VAL-141
ALA-142
5.9
4.7
3.0
-177.4
40.7
57.5
-574.4
ALA-142
THR-143
6.3
5.3
48.9
-152.9
100.9
19.2
972.8
THR-143
ARG-144
5.2
7.6
47.7
-88.8
44.6
63.5
-213.0
ARG-144
LYS-145
3.8
6.0
-68.3
-28.4
97.6
132.5
-312.6
LYS-145
SER-146
5.6
6.9
-175.0
120.8
80.4
88.3
-4.5
SER-146
SER-147
7.3
5.9
19.6
14.5
83.4
59.9
77.4
SER-147
LEU-148
7.4
4.9
121.2
-69.0
58.4
45.5
215.0
LEU-148
LYS-149
10.9
7.8
66.5
-87.0
74.0
74.5
43.6
LYS-149
THR-150
10.0
9.8
30.5
-2.7
143.3
140.0
-112.2
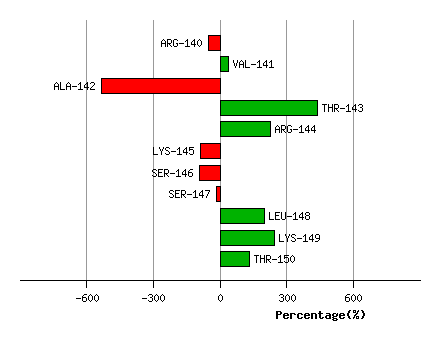
Graph shows rotational transition at bending residues and can be used
to identify hinge bending residues.
Probably only informative for interdomain rotations greater than 20 degrees
Residue
iResidue
i+1Distance of hinge axis to residue i in
(A) Distance of hinge axis to residue i in
(A) Change in
(deg) Change in
(deg) Angle of psi(i) axis to hinge axis
(deg) Angle of psi(i) axis to hinge axis
(deg) Percentage Progress
PRO-160
LYS-161
5.6
5.7
27.2
-10.6
28.2
34.5
69.9
LYS-161
PRO-162
4.6
4.0
29.7
-3.9
88.0
93.2
-17.3
PRO-162
TYR-163
1.7
0.3
-10.4
21.5
138.4
129.0
33.3

Graph shows rotational transition at bending residues and can be used
to identify hinge bending residues.
Probably only informative for interdomain rotations greater than 20 degrees