Camp-Dependent Protein Kinase (E.C.2.7.1.37)
(All numbering and residues are taken from first PDB file)
![]()
![]()
Bending Residue Dihedral Analysis
Residue
iResidue
i+1Distance of hinge axis to residue i in
(A) Distance of hinge axis to residue i in
(A) Change in
(deg) Change in
(deg) Angle of psi(i) axis to hinge axis
(deg) Angle of psi(i) axis to hinge axis
(deg) Percentage Progress
LYS-29
TRP-30
8.0
8.6
2.3
-6.9
126.3
118.7
7.4
TRP-30
GLU-31
6.6
6.8
-3.6
-15.0
34.7
26.0
84.2
GLU-31
THR-32
7.2
7.4
15.5
-1.3
86.4
90.3
-60.1
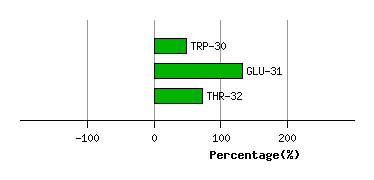
Graph shows rotational transition at bending residues and can be used
to identify hinge bending residues.
Probably only informative for interdomain rotations greater than 20 degrees
Residue
iResidue
i+1Distance of hinge axis to residue i in
(A) Distance of hinge axis to residue i in
(A) Change in
(deg) Change in
(deg) Angle of psi(i) axis to hinge axis
(deg) Angle of psi(i) axis to hinge axis
(deg) Percentage Progress
GLU-91
LYS-92
6.4
5.7
0.9
8.2
104.2
102.7
78.5
LYS-92
ARG-93
3.3
2.5
-3.4
-3.8
109.1
116.6
-7.5
ARG-93
ILE-94
1.9
1.4
-2.4
16.6
62.5
64.8
-58.7

Graph shows rotational transition at bending residues and can be used
to identify hinge bending residues.
Probably only informative for interdomain rotations greater than 20 degrees
Residue
iResidue
i+1Distance of hinge axis to residue i in
(A) Distance of hinge axis to residue i in
(A) Change in
(deg) Change in
(deg) Angle of psi(i) axis to hinge axis
(deg) Angle of psi(i) axis to hinge axis
(deg) Percentage Progress
VAL-104
LYS-105
4.4
4.7
-22.4
12.9
52.9
52.4
104.8
LYS-105
LEU-106
2.6
3.0
-8.7
24.4
71.1
77.5
30.1
LEU-106
GLU-107
1.2
1.5
-6.0
1.4
90.4
96.7
-26.7

Graph shows rotational transition at bending residues and can be used
to identify hinge bending residues.
Probably only informative for interdomain rotations greater than 20 degrees
Residue
iResidue
i+1Distance of hinge axis to residue i in
(A) Distance of hinge axis to residue i in
(A) Change in
(deg) Change in
(deg) Angle of psi(i) axis to hinge axis
(deg) Angle of psi(i) axis to hinge axis
(deg) Percentage Progress
MET-120
GLU-121
2.9
2.6
-1.9
-9.0
11.8
22.9
133.4
GLU-121
TYR-122
1.5
1.3
-5.1
7.7
58.6
55.7
17.8
TYR-122
VAL-123
3.1
2.4
4.9
-18.0
123.8
125.1
-14.6

Graph shows rotational transition at bending residues and can be used
to identify hinge bending residues.
Probably only informative for interdomain rotations greater than 20 degrees
Residue
iResidue
i+1Distance of hinge axis to residue i in
(A) Distance of hinge axis to residue i in
(A) Change in
(deg) Change in
(deg) Angle of psi(i) axis to hinge axis
(deg) Angle of psi(i) axis to hinge axis
(deg) Percentage Progress
THR-183
ASP-184
8.4
8.4
-17.0
14.3
39.8
37.0
50.2
ASP-184
PHE-185
10.0
9.6
-7.8
2.9
41.9
36.3
47.8
PHE-185
GLY-186
9.1
8.8
11.4
-24.0
143.4
148.3
42.0
GLY-186
PHE-187
10.9
10.2
12.3
-6.7
136.0
120.4
-55.0
PHE-187
ALA-188
13.1
13.2
7.9
-15.3
110.7
104.5
-21.5
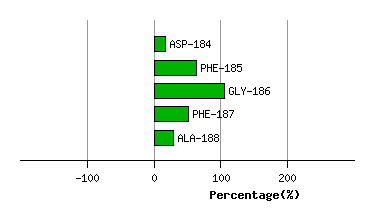
Graph shows rotational transition at bending residues and can be used
to identify hinge bending residues.
Probably only informative for interdomain rotations greater than 20 degrees
Residue
iResidue
i+1Distance of hinge axis to residue i in
(A) Distance of hinge axis to residue i in
(A) Change in
(deg) Change in
(deg) Angle of psi(i) axis to hinge axis
(deg) Angle of psi(i) axis to hinge axis
(deg) Percentage Progress
ILE-314
PRO-315
10.2
10.2
1.3
5.7
79.9
74.4
-43.9
PRO-315
LYS-316
8.7
9.4
7.1
-20.5
62.3
58.8
-41.5
LYS-316
PHE-317
6.1
7.2
-52.7
57.2
79.1
85.8
-75.4
PHE-317
LYS-318
4.5
8.4
11.4
3.8
57.7
49.3
130.1
LYS-318
GLY-319
4.7
9.0
85.7
-0.7
117.1
113.0
-193.1
GLY-319
PRO-320
5.4
9.6
-40.1
-1.2
6.3
74.4
271.5
PRO-320
GLY-321
5.7
7.9
-4.3
-44.9
74.1
49.4
184.4
GLY-321
ASP-322
7.9
9.5
94.8
179.6
57.9
100.8
-69.4
ASP-322
THR-323
7.9
11.5
-146.1
-177.0
50.8
103.0
-59.2
THR-323
SER-324
9.9
10.5
-162.3
-106.9
115.4
110.2
270.5
SER-324
ASN-325
11.1
14.0
-11.4
9.6
64.7
50.5
-119.0
ASN-325
PHE-326
10.9
14.2
-50.4
62.9
35.2
21.4
3.2
PHE-326
ASP-327
13.0
12.6
141.9
-147.5
75.3
106.6
-165.8
ASP-327
ASP-328
16.7
15.6
-37.2
10.4
77.5
90.7
-72.3

Graph shows rotational transition at bending residues and can be used
to identify hinge bending residues.
Probably only informative for interdomain rotations greater than 20 degrees