Pyruvate Kinase
(All numbering and residues are taken from first PDB file)
![]()
![]()
Bending Residue Dihedral Analysis
Residue
iResidue
i+1Distance of hinge axis to residue i in
(A) Distance of hinge axis to residue i in
(A) Change in
(deg) Change in
(deg) Angle of psi(i) axis to hinge axis
(deg) Angle of psi(i) axis to hinge axis
(deg) Percentage Progress
GLU-88
ILE-89
4.8
4.1
-10.7
14.8
69.1
66.3
14.0
ILE-89
ARG-90
1.1
0.5
23.7
-27.1
74.0
78.9
-8.9
ARG-90
THR-91
3.9
3.3
-13.7
7.3
77.3
73.9
21.0

Graph shows rotational transition at bending residues and can be used
to identify hinge bending residues.
Probably only informative for interdomain rotations greater than 20 degrees
Residue
iResidue
i+1Distance of hinge axis to residue i in
(A) Distance of hinge axis to residue i in
(A) Change in
(deg) Change in
(deg) Angle of psi(i) axis to hinge axis
(deg) Angle of psi(i) axis to hinge axis
(deg) Percentage Progress
TYR-125
ILE-126
9.4
9.5
17.6
-12.1
125.5
115.7
-4.9
ILE-126
ASP-127
6.0
6.0
13.2
25.3
43.9
40.6
114.1
ASP-127
TYR-128
3.2
2.9
-54.7
28.6
90.3
101.7
-26.6
TYR-128
GLN-129
3.8
4.9
-15.9
-16.2
61.6
59.4
107.9
TYR-128
GLN-129
3.8
4.9
-15.9
-16.2
61.6
59.4
107.9
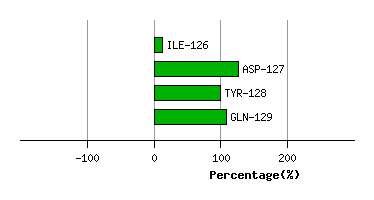
Graph shows rotational transition at bending residues and can be used
to identify hinge bending residues.
Probably only informative for interdomain rotations greater than 20 degrees
Residue
iResidue
i+1Distance of hinge axis to residue i in
(A) Distance of hinge axis to residue i in
(A) Change in
(deg) Change in
(deg) Angle of psi(i) axis to hinge axis
(deg) Angle of psi(i) axis to hinge axis
(deg) Percentage Progress
TYR-128
GLN-129
3.8
4.9
-15.9
-16.2
61.6
59.4
107.9
TYR-128
GLN-129
3.8
4.9
-15.9
-16.2
61.6
59.4
107.9
GLN-129
ASN-130
6.4
7.1
18.6
9.3
67.9
77.1
52.7
ASN-130
LEU-131
9.5
9.8
-30.3
1.7
165.9
166.2
-100.9

Graph shows rotational transition at bending residues and can be used
to identify hinge bending residues.
Probably only informative for interdomain rotations greater than 20 degrees
Residue
iResidue
i+1Distance of hinge axis to residue i in
(A) Distance of hinge axis to residue i in
(A) Change in
(deg) Change in
(deg) Angle of psi(i) axis to hinge axis
(deg) Angle of psi(i) axis to hinge axis
(deg) Percentage Progress
SER-132
LYS-133
12.5
13.0
2.1
-11.2
101.6
96.9
17.6
LYS-133
VAL-134
13.8
14.5
-16.1
10.6
27.6
33.6
24.9
VAL-134
VAL-135
11.9
13.1
-7.0
24.1
28.9
31.5
-48.3
VAL-135
ARG-136
12.4
12.7
3.1
-31.5
90.1
92.9
0.9

Graph shows rotational transition at bending residues and can be used
to identify hinge bending residues.
Probably only informative for interdomain rotations greater than 20 degrees
Residue
iResidue
i+1Distance of hinge axis to residue i in
(A) Distance of hinge axis to residue i in
(A) Change in
(deg) Change in
(deg) Angle of psi(i) axis to hinge axis
(deg) Angle of psi(i) axis to hinge axis
(deg) Percentage Progress
ARG-174
ARG-175
9.1
9.1
19.0
-51.5
156.7
144.3
97.3
ARG-175
GLY-176
7.9
7.4
27.6
-4.5
84.2
88.6
-11.7
GLY-176
VAL-177
4.8
4.0
3.1
2.2
111.0
110.6
-18.6
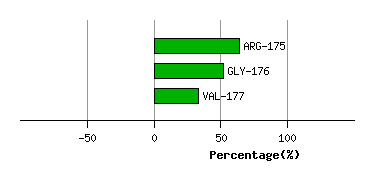
Graph shows rotational transition at bending residues and can be used
to identify hinge bending residues.
Probably only informative for interdomain rotations greater than 20 degrees