Methylcitrate Synthase
(All numbering and residues are taken from first PDB file)
![]()
![]()
Bending Residue Dihedral Analysis
Residue
iResidue
i+1Distance of hinge axis to residue i in
(A) Distance of hinge axis to residue i in
(A) Change in
(deg) Change in
(deg) Angle of psi(i) axis to hinge axis
(deg) Angle of psi(i) axis to hinge axis
(deg) Percentage Progress
VAL-193
VAL-194
8.4
8.6
-7.9
7.5
39.7
38.0
-58.4
VAL-194
SER-195
8.5
8.6
6.0
-13.9
140.4
140.7
155.9
SER-195
ALA-196
8.8
8.7
3.0
4.5
85.5
84.7
-88.9
ALA-196
PHE-197
6.8
6.8
-1.8
-0.7
95.5
95.4
-17.9
ALA-196
PHE-197
6.8
6.8
-1.8
-0.7
95.5
95.4
-17.9

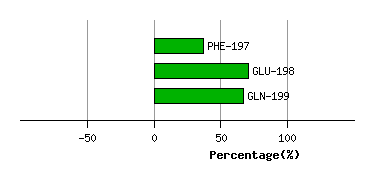
Graph shows rotational transition at bending residues and can be used
to identify hinge bending residues.
Probably only informative for interdomain rotations greater than 20 degrees
Residue
iResidue
i+1Distance of hinge axis to residue i in
(A) Distance of hinge axis to residue i in
(A) Change in
(deg) Change in
(deg) Angle of psi(i) axis to hinge axis
(deg) Angle of psi(i) axis to hinge axis
(deg) Percentage Progress
ALA-196
PHE-197
6.8
6.8
-1.8
-0.7
95.5
95.4
-17.9
ALA-196
PHE-197
6.8
6.8
-1.8
-0.7
95.5
95.4
-17.9
PHE-197
GLU-198
3.6
3.5
2.7
-0.9
16.2
14.7
33.6
GLU-198
GLN-199
4.2
4.2
-0.4
-1.6
122.0
122.3
-3.5
Graph shows rotational transition at bending residues and can be used
to identify hinge bending residues.
Probably only informative for interdomain rotations greater than 20 degrees
Residue
iResidue
i+1Distance of hinge axis to residue i in
(A) Distance of hinge axis to residue i in
(A) Change in
(deg) Change in
(deg) Angle of psi(i) axis to hinge axis
(deg) Angle of psi(i) axis to hinge axis
(deg) Percentage Progress
LEU-241
HIS-242
19.5
20.1
6.3
-6.7
139.8
140.0
77.3
HIS-242
GLY-243
16.5
17.1
27.7
-15.2
60.0
66.7
49.3
GLY-243
GLY-244
13.1
13.7
8.9
-1.4
2.0
16.8
280.9
GLY-244
ALA-245
14.2
14.3
-14.0
17.5
111.4
103.5
-178.5
ALA-245
ASN-246
14.3
14.0
-9.6
12.7
108.0
111.6
-35.5

Graph shows rotational transition at bending residues and can be used
to identify hinge bending residues.
Probably only informative for interdomain rotations greater than 20 degrees
Residue
iResidue
i+1Distance of hinge axis to residue i in
(A) Distance of hinge axis to residue i in
(A) Change in
(deg) Change in
(deg) Angle of psi(i) axis to hinge axis
(deg) Angle of psi(i) axis to hinge axis
(deg) Percentage Progress
ARG-263
GLU-264
25.2
25.3
-12.2
13.8
64.0
63.8
-46.2
GLU-264
TRP-265
26.0
25.9
8.5
-7.6
76.8
77.2
-66.3
TRP-265
LEU-266
23.2
23.1
5.4
-7.9
27.7
36.7
86.2
LEU-266
ARG-267
24.3
24.5
20.7
2.6
87.8
91.8
52.5
ARG-267
ALA-268
28.0
28.1
-12.0
-3.7
70.3
78.8
-36.2
ALA-268
LYS-269
27.7
27.5
26.2
-27.4
49.3
48.8
125.5

Graph shows rotational transition at bending residues and can be used
to identify hinge bending residues.
Probably only informative for interdomain rotations greater than 20 degrees
Residue
iResidue
i+1Distance of hinge axis to residue i in
(A) Distance of hinge axis to residue i in
(A) Change in
(deg) Change in
(deg) Angle of psi(i) axis to hinge axis
(deg) Angle of psi(i) axis to hinge axis
(deg) Percentage Progress
ILE-276
MET-277
21.3
21.6
19.5
-23.3
122.7
122.5
211.8
MET-277
GLY-278
17.8
18.0
-3.8
-8.0
67.9
65.9
263.4
GLY-278
PHE-279
16.1
16.1
37.9
-12.6
122.9
115.8
-354.1
PHE-279
GLY-280
19.4
19.2
-6.7
-46.4
57.5
38.4
1066.1
GLY-280
HIS-281
21.2
20.5
47.9
-1.9
135.6
115.6
-992.0
HIS-281
ARG-282
20.1
20.1
12.3
4.8
134.0
122.9
-76.9
ARG-282
VAL-283
21.8
21.8
-3.6
8.9
34.5
29.7
-64.6
VAL-283
TYR-284
20.5
20.2
-13.4
5.8
99.3
99.4
-84.2
TYR-284
ARG-285
20.0
19.7
-4.6
7.8
116.8
115.9
124.8
ARG-285
HIS-286
23.4
23.2
-11.4
25.2
106.8
101.4
76.3
HIS-286
GLY-287
23.0
22.9
-15.2
5.1
107.9
117.4
-138.2
GLY-287
ASP-288
19.7
19.8
16.2
-12.1
114.3
106.0
-141.1
ASP-288
SER-289
16.2
16.0
1.7
-18.7
116.3
111.0
103.2
SER-289
ARG-290
14.2
14.3
1.3
15.5
60.8
61.6
178.3
SER-289
ARG-290
14.2
14.3
1.3
15.5
60.8
61.6
178.3
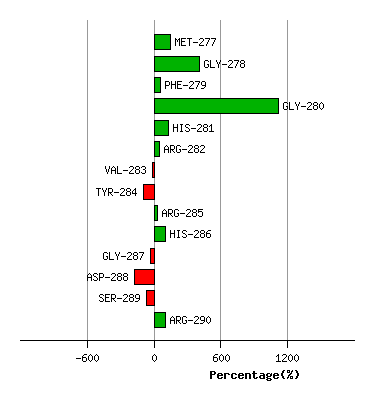
Graph shows rotational transition at bending residues and can be used
to identify hinge bending residues.
Probably only informative for interdomain rotations greater than 20 degrees
Residue
iResidue
i+1Distance of hinge axis to residue i in
(A) Distance of hinge axis to residue i in
(A) Change in
(deg) Change in
(deg) Angle of psi(i) axis to hinge axis
(deg) Angle of psi(i) axis to hinge axis
(deg) Percentage Progress
SER-289
ARG-290
14.2
14.3
1.3
15.5
60.8
61.6
178.3
SER-289
ARG-290
14.2
14.3
1.3
15.5
60.8
61.6
178.3
ARG-290
VAL-291
11.2
11.2
0.1
2.1
30.4
30.5
18.5
VAL-291
PRO-292
13.0
13.1
-3.5
-0.6
96.5
98.3
-50.9

Graph shows rotational transition at bending residues and can be used
to identify hinge bending residues.
Probably only informative for interdomain rotations greater than 20 degrees
Residue
iResidue
i+1Distance of hinge axis to residue i in
(A) Distance of hinge axis to residue i in
(A) Change in
(deg) Change in
(deg) Angle of psi(i) axis to hinge axis
(deg) Angle of psi(i) axis to hinge axis
(deg) Percentage Progress
MET-294
LYS-295
9.7
9.7
1.5
-0.5
142.2
141.8
14.6
LYS-295
ARG-296
12.8
12.9
1.5
-5.0
95.2
98.3
-39.6
ARG-296
ALA-297
13.6
13.6
-2.8
7.4
66.8
68.1
-72.0

Graph shows rotational transition at bending residues and can be used
to identify hinge bending residues.
Probably only informative for interdomain rotations greater than 20 degrees
Residue
iResidue
i+1Distance of hinge axis to residue i in
(A) Distance of hinge axis to residue i in
(A) Change in
(deg) Change in
(deg) Angle of psi(i) axis to hinge axis
(deg) Angle of psi(i) axis to hinge axis
(deg) Percentage Progress
VAL-301
GLY-302
10.2
10.4
-8.1
8.4
151.1
153.2
-2.4
GLY-302
THR-303
12.0
11.9
2.7
-13.5
66.6
64.1
-83.6
THR-303
VAL-304
15.1
14.9
15.5
-3.1
66.0
76.7
139.2
VAL-304
ARG-305
13.6
13.4
-10.6
3.4
133.0
134.9
-54.9
ARG-305
ASP-306
10.5
10.4
11.5
-6.0
44.5
44.6
98.5
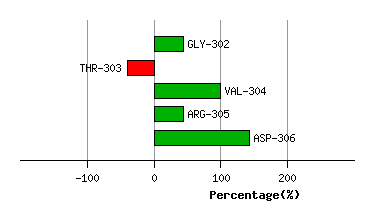
Graph shows rotational transition at bending residues and can be used
to identify hinge bending residues.
Probably only informative for interdomain rotations greater than 20 degrees
Residue
iResidue
i+1Distance of hinge axis to residue i in
(A) Distance of hinge axis to residue i in
(A) Change in
(deg) Change in
(deg) Angle of psi(i) axis to hinge axis
(deg) Angle of psi(i) axis to hinge axis
(deg) Percentage Progress
GLN-315
VAL-316
19.8
20.1
13.6
-10.3
108.5
111.7
50.5
VAL-316
LEU-317
21.9
22.1
1.5
-13.1
71.0
72.8
-118.7
LEU-317
ALA-318
20.7
21.1
32.3
-1.9
16.3
12.6
794.7

Graph shows rotational transition at bending residues and can be used
to identify hinge bending residues.
Probably only informative for interdomain rotations greater than 20 degrees
Residue
iResidue
i+1Distance of hinge axis to residue i in
(A) Distance of hinge axis to residue i in
(A) Change in
(deg) Change in
(deg) Angle of psi(i) axis to hinge axis
(deg) Angle of psi(i) axis to hinge axis
(deg) Percentage Progress
GLY-326
ILE-327
28.0
27.9
13.0
-3.8
110.9
112.4
-197.4
ILE-327
LEU-328
24.6
24.6
-11.0
7.0
102.7
107.5
-247.4
LEU-328
PRO-329
21.4
21.7
5.0
-2.9
75.1
70.3
-17.0
PRO-329
ASN-330
17.9
18.2
-17.8
1.7
36.1
41.6
374.6
ASN-330
LEU-331
15.4
15.5
6.1
-8.6
73.0
72.8
-29.6

Graph shows rotational transition at bending residues and can be used
to identify hinge bending residues.
Probably only informative for interdomain rotations greater than 20 degrees
Residue
iResidue
i+1Distance of hinge axis to residue i in
(A) Distance of hinge axis to residue i in
(A) Change in
(deg) Change in
(deg) Angle of psi(i) axis to hinge axis
(deg) Angle of psi(i) axis to hinge axis
(deg) Percentage Progress
PHE-344
ASP-345
2.3
2.3
-8.9
11.7
47.1
46.8
38.8
ASP-345
ILE-346
4.6
4.7
3.6
-11.5
63.5
57.1
-54.7
ILE-346
ALA-347
6.5
6.6
1.7
1.8
60.9
61.8
52.9

Graph shows rotational transition at bending residues and can be used
to identify hinge bending residues.
Probably only informative for interdomain rotations greater than 20 degrees