Hexokinase
(All numbering and residues are taken from first PDB file)
![]()
![]()
Bending Residue Dihedral Analysis
Residue
iResidue
i+1Distance of hinge axis to residue i in
(A) Distance of hinge axis to residue i in
(A) Change in
(deg) Change in
(deg) Angle of psi(i) axis to hinge axis
(deg) Angle of psi(i) axis to hinge axis
(deg) Percentage Progress
THR-75
GLY-76
14.9
15.0
-4.1
0.7
38.1
38.1
58.6
GLY-76
LYS-77
15.6
15.8
4.0
5.9
78.9
81.3
-10.8
LYS-77
GLU-78
16.4
16.6
-1.5
-5.3
93.6
85.6
-14.3
GLU-78
THR-79
13.1
13.4
0.2
0.0
132.2
136.5
-3.3
THR-79
GLY-80
14.1
14.4
0.2
-9.0
92.1
94.1
95.5
GLY-80
ASP-81
13.0
13.4
3.2
0.1
150.1
142.9
-75.0
ASP-81
PHE-82
11.5
11.6
3.0
-1.1
78.6
76.7
-48.2
PHE-82
LEU-83
7.8
7.9
1.7
-7.6
147.4
149.0
101.3
LEU-83
ALA-84
6.1
6.0
-1.2
0.6
88.7
90.1
32.4

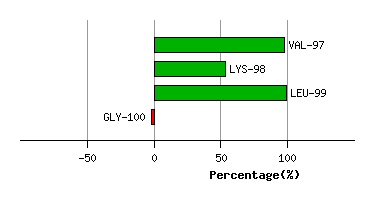
Graph shows rotational transition at bending residues and can be used
to identify hinge bending residues.
Probably only informative for interdomain rotations greater than 20 degrees
Residue
iResidue
i+1Distance of hinge axis to residue i in
(A) Distance of hinge axis to residue i in
(A) Change in
(deg) Change in
(deg) Angle of psi(i) axis to hinge axis
(deg) Angle of psi(i) axis to hinge axis
(deg) Percentage Progress
LEU-96
VAL-97
8.6
8.3
10.9
-11.2
97.2
97.6
89.4
VAL-97
LYS-98
9.0
9.2
-2.1
1.3
48.4
49.5
-44.0
LYS-98
LEU-99
12.4
12.7
-6.2
3.7
72.4
68.6
45.9
LEU-99
GLY-100
12.9
13.3
0.6
-10.8
76.0
76.4
-2.0
LEU-99
GLY-100
12.9
13.3
0.6
-10.8
76.0
76.4
-2.0
Graph shows rotational transition at bending residues and can be used
to identify hinge bending residues.
Probably only informative for interdomain rotations greater than 20 degrees
Residue
iResidue
i+1Distance of hinge axis to residue i in
(A) Distance of hinge axis to residue i in
(A) Change in
(deg) Change in
(deg) Angle of psi(i) axis to hinge axis
(deg) Angle of psi(i) axis to hinge axis
(deg) Percentage Progress
LEU-99
GLY-100
12.9
13.3
0.6
-10.8
76.0
76.4
-2.0
LEU-99
GLY-100
12.9
13.3
0.6
-10.8
76.0
76.4
-2.0
GLY-100
GLY-101
16.7
17.1
11.1
-6.7
32.2
34.7
31.9
GLY-101
ASN-102
17.2
17.5
3.4
0.3
94.2
93.1
114.2
ASN-102
HIS-103
19.4
19.6
3.8
1.0
130.0
127.8
-91.3

Graph shows rotational transition at bending residues and can be used
to identify hinge bending residues.
Probably only informative for interdomain rotations greater than 20 degrees
Residue
iResidue
i+1Distance of hinge axis to residue i in
(A) Distance of hinge axis to residue i in
(A) Change in
(deg) Change in
(deg) Angle of psi(i) axis to hinge axis
(deg) Angle of psi(i) axis to hinge axis
(deg) Percentage Progress
PHE-156
SER-157
8.8
8.8
9.0
1.5
91.8
76.6
81.9
SER-157
TYR-158
10.9
10.8
-12.5
-4.7
104.0
100.4
-49.9
TYR-158
PRO-159
14.3
14.2
10.3
-13.0
151.2
149.9
-7.0
PRO-159
ALA-160
16.9
16.9
0.4
-4.0
131.6
137.4
-37.7
ALA-160
SER-161
15.8
15.5
0.3
-25.3
152.8
145.9
340.7
SER-161
GLN-162
15.8
15.3
10.0
-9.1
115.9
123.3
170.5
GLN-162
LYS-163
12.7
12.8
29.2
-10.7
163.8
155.5
-448.0
LYS-163
LYS-164
12.5
12.6
-0.1
2.2
73.1
71.0
31.1
LYS-164
ILE-165
8.8
8.8
-6.7
0.0
155.2
153.8
-64.1
ILE-165
ASN-166
6.3
6.2
0.7
3.9
60.3
62.2
22.9
ILE-165
ASN-166
6.3
6.2
0.7
3.9
60.3
62.2
22.9

Graph shows rotational transition at bending residues and can be used
to identify hinge bending residues.
Probably only informative for interdomain rotations greater than 20 degrees
Residue
iResidue
i+1Distance of hinge axis to residue i in
(A) Distance of hinge axis to residue i in
(A) Change in
(deg) Change in
(deg) Angle of psi(i) axis to hinge axis
(deg) Angle of psi(i) axis to hinge axis
(deg) Percentage Progress
ILE-165
ASN-166
6.3
6.2
0.7
3.9
60.3
62.2
22.9
ILE-165
ASN-166
6.3
6.2
0.7
3.9
60.3
62.2
22.9
ASN-166
SER-167
6.7
6.5
3.0
-4.2
82.7
83.6
26.0
SER-167
GLY-168
10.2
10.0
-1.6
-1.0
133.7
136.3
-21.7
GLY-168
VAL-169
12.3
12.0
12.2
-9.3
79.7
76.4
-15.4
VAL-169
LEU-170
16.1
15.8
5.5
-5.5
38.7
35.1
14.4

Graph shows rotational transition at bending residues and can be used
to identify hinge bending residues.
Probably only informative for interdomain rotations greater than 20 degrees
Residue
iResidue
i+1Distance of hinge axis to residue i in
(A) Distance of hinge axis to residue i in
(A) Change in
(deg) Change in
(deg) Angle of psi(i) axis to hinge axis
(deg) Angle of psi(i) axis to hinge axis
(deg) Percentage Progress
ALA-206
LEU-207
3.5
3.4
-1.1
-7.9
145.1
145.6
-152.7
LEU-207
ILE-208
6.1
6.0
-5.3
0.4
91.5
90.6
132.2
ILE-208
ASN-209
6.8
6.8
0.6
1.6
36.4
38.7
37.4

Graph shows rotational transition at bending residues and can be used
to identify hinge bending residues.
Probably only informative for interdomain rotations greater than 20 degrees
Residue
iResidue
i+1Distance of hinge axis to residue i in
(A) Distance of hinge axis to residue i in
(A) Change in
(deg) Change in
(deg) Angle of psi(i) axis to hinge axis
(deg) Angle of psi(i) axis to hinge axis
(deg) Percentage Progress
ALA-467
CYS-468
2.3
2.3
-3.6
0.9
126.7
129.5
-19.5
CYS-468
LEU-469
5.8
5.8
-2.1
-2.5
152.3
150.1
-80.7
LEU-469
THR-470
5.3
5.4
6.9
-4.0
55.6
56.3
106.3

Graph shows rotational transition at bending residues and can be used
to identify hinge bending residues.
Probably only informative for interdomain rotations greater than 20 degrees
Residue
iResidue
i+1Distance of hinge axis to residue i in
(A) Distance of hinge axis to residue i in
(A) Change in
(deg) Change in
(deg) Angle of psi(i) axis to hinge axis
(deg) Angle of psi(i) axis to hinge axis
(deg) Percentage Progress
LEU-474
ALA-475
3.6
3.5
-7.9
0.8
60.6
60.1
57.7
ALA-475
ALA-476
6.8
6.8
6.7
1.5
162.6
165.4
-99.9
ALA-476
GLY-477
5.7
5.5
7.7
-8.1
123.7
122.2
-1.1
GLY-477
LYS-478
3.3
3.9
3.4
-9.8
94.0
97.0
69.2
LYS-478
SER-479
1.0
0.2
11.9
-3.6
58.2
50.3
134.6
SER-479
VAL-480
3.2
3.4
0.3
-1.7
25.6
32.6
-42.1
VAL-480
GLY-481
4.5
4.5
9.3
-5.1
78.2
76.4
-33.7

Graph shows rotational transition at bending residues and can be used
to identify hinge bending residues.
Probably only informative for interdomain rotations greater than 20 degrees