Chaperone Protein Htpg
(All numbering and residues are taken from first PDB file)
![]()
![]()
Bending Residue Dihedral Analysis
Residue
iResidue
i+1Distance of hinge axis to residue i in
(A) Distance of hinge axis to residue i in
(A) Change in
(deg) Change in
(deg) Angle of psi(i) axis to hinge axis
(deg) Angle of psi(i) axis to hinge axis
(deg) Percentage Progress
LEU-24
TYR-25
1.4
1.7
-91.3
115.4
25.2
47.9
-13.0
TYR-25
SER-26
1.9
3.8
27.1
124.4
134.4
167.2
-87.8
SER-26
ASN-27
3.5
3.0
43.5
-2.9
108.3
120.4
-1.6
ASN-27
LYS-28
3.6
2.3
-54.4
125.7
102.1
111.1
-8.0
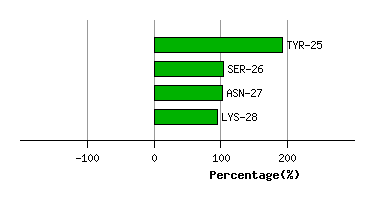
Graph shows rotational transition at bending residues and can be used
to identify hinge bending residues.
Probably only informative for interdomain rotations greater than 20 degrees
Residue
iResidue
i+1Distance of hinge axis to residue i in
(A) Distance of hinge axis to residue i in
(A) Change in
(deg) Change in
(deg) Angle of psi(i) axis to hinge axis
(deg) Angle of psi(i) axis to hinge axis
(deg) Percentage Progress
GLY-95
THR-96
16.1
15.5
-11.7
62.8
60.6
63.2
-9.3
THR-96
ILE-97
13.4
12.6
101.1
99.6
59.3
47.2
-48.8
ILE-97
ALA-98
11.9
10.9
-147.0
-27.8
43.0
106.6
107.8
ALA-98
LYS-99
13.7
11.7
21.5
4.1
104.1
133.7
-17.4
LYS-99
SER-100
11.5
10.6
-68.1
73.0
57.9
103.3
-14.4
SER-100
GLY-101
8.1
7.5
81.3
52.7
53.4
112.4
28.3
GLY-101
THR-102
5.0
4.2
-62.4
36.3
66.7
24.4
11.6

Graph shows rotational transition at bending residues and can be used
to identify hinge bending residues.
Probably only informative for interdomain rotations greater than 20 degrees
Residue
iResidue
i+1Distance of hinge axis to residue i in
(A) Distance of hinge axis to residue i in
(A) Change in
(deg) Change in
(deg) Angle of psi(i) axis to hinge axis
(deg) Angle of psi(i) axis to hinge axis
(deg) Percentage Progress
PHE-105
LEU-106
3.4
2.7
-28.8
-6.2
97.2
167.3
-11.4
LEU-106
GLU-107
6.0
2.3
-30.0
82.0
84.4
122.1
28.3
GLU-107
SER-108
8.8
5.5
152.2
4.5
170.4
55.0
57.4
SER-117
GLN-118
10.5
10.5
-128.7
27.7
115.2
42.7
-35.0
GLN-118
LEU-119
8.1
13.9
-110.4
7.8
168.2
44.9
-33.0
LEU-119
ILE-120
8.1
13.8
-165.6
62.4
112.8
48.2
78.7
ILE-120
GLY-121
7.0
10.2
36.0
-130.0
9.0
122.3
-24.2
GLY-121
GLN-122
8.6
12.2
4.3
81.8
76.6
170.3
-32.0
GLN-122
PHE-123
8.4
13.5
-137.3
-86.4
77.4
72.5
-25.1
PHE-123
GLY-124
7.3
12.5
-176.5
33.1
120.2
86.4
-8.8
GLY-124
VAL-125
5.3
8.9
85.1
90.7
83.6
152.6
105.5
VAL-125
GLY-126
8.3
7.5
168.9
-29.5
138.6
130.0
-67.9
GLY-126
PHE-127
10.8
9.8
30.2
4.2
107.3
77.9
-7.1
PHE-127
TYR-128
12.1
9.9
-29.8
13.7
83.1
71.6
2.0
TYR-128
SER-129
9.4
6.6
-37.6
-5.2
38.6
13.5
23.5

Graph shows rotational transition at bending residues and can be used
to identify hinge bending residues.
Probably only informative for interdomain rotations greater than 20 degrees