Endo-Beta-1,4-Glucanase
(All numbering and residues are taken from first PDB file)
![]()
![]()
Bending Residue Dihedral Analysis
Residue
iResidue
i+1Distance of hinge axis to residue i in
(A) Distance of hinge axis to residue i in
(A) Change in
(deg) Change in
(deg) Angle of psi(i) axis to hinge axis
(deg) Angle of psi(i) axis to hinge axis
(deg) Percentage Progress
SER-63
GLN-64
8.3
8.0
-0.5
-2.8
56.1
56.6
-5.0
GLN-64
ILE-65
7.2
7.0
7.0
-15.2
159.8
161.7
75.8
ILE-65
ALA-66
6.4
6.3
0.6
-8.4
124.4
122.0
-8.2

Graph shows rotational transition at bending residues and can be used
to identify hinge bending residues.
Probably only informative for interdomain rotations greater than 20 degrees
Residue
iResidue
i+1Distance of hinge axis to residue i in
(A) Distance of hinge axis to residue i in
(A) Change in
(deg) Change in
(deg) Angle of psi(i) axis to hinge axis
(deg) Angle of psi(i) axis to hinge axis
(deg) Percentage Progress
MET-79
PRO-80
5.6
5.7
-1.2
2.2
49.4
48.7
10.2
PRO-80
THR-81
5.6
5.8
-5.0
3.3
60.3
57.9
28.1
THR-81
THR-82
4.0
4.4
0.0
-1.8
129.1
131.3
-7.3

Graph shows rotational transition at bending residues and can be used
to identify hinge bending residues.
Probably only informative for interdomain rotations greater than 20 degrees
Residue
iResidue
i+1Distance of hinge axis to residue i in
(A) Distance of hinge axis to residue i in
(A) Change in
(deg) Change in
(deg) Angle of psi(i) axis to hinge axis
(deg) Angle of psi(i) axis to hinge axis
(deg) Percentage Progress
ARG-93
ALA-94
6.3
6.5
3.4
-5.0
163.6
164.5
-8.7
ALA-94
ASN-95
6.0
6.0
-1.0
-5.8
60.7
64.5
28.6
ASN-95
VAL-96
4.1
3.9
1.5
-0.1
138.7
139.0
12.5

Graph shows rotational transition at bending residues and can be used
to identify hinge bending residues.
Probably only informative for interdomain rotations greater than 20 degrees
Residue
iResidue
i+1Distance of hinge axis to residue i in
(A) Distance of hinge axis to residue i in
(A) Change in
(deg) Change in
(deg) Angle of psi(i) axis to hinge axis
(deg) Angle of psi(i) axis to hinge axis
(deg) Percentage Progress
ASN-164
THR-165
5.7
5.7
-11.6
19.1
133.4
136.7
107.3
THR-165
THR-166
6.9
7.0
-8.2
6.6
115.4
116.7
17.5
THR-166
ASN-167
7.2
7.4
-5.4
3.7
149.3
149.8
-96.0

Graph shows rotational transition at bending residues and can be used
to identify hinge bending residues.
Probably only informative for interdomain rotations greater than 20 degrees
Residue
iResidue
i+1Distance of hinge axis to residue i in
(A) Distance of hinge axis to residue i in
(A) Change in
(deg) Change in
(deg) Angle of psi(i) axis to hinge axis
(deg) Angle of psi(i) axis to hinge axis
(deg) Percentage Progress
TYR-168
SER-169
7.8
8.1
0.0
5.3
6.1
5.9
-52.4
SER-169
GLY-170
8.7
9.0
5.6
0.2
97.4
100.1
-43.2
GLY-170
ASP-171
8.4
8.5
-5.2
-1.3
33.2
29.9
81.6
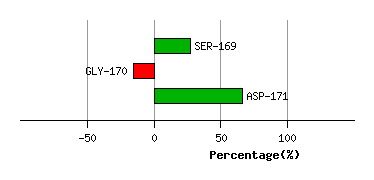
Graph shows rotational transition at bending residues and can be used
to identify hinge bending residues.
Probably only informative for interdomain rotations greater than 20 degrees
Residue
iResidue
i+1Distance of hinge axis to residue i in
(A) Distance of hinge axis to residue i in
(A) Change in
(deg) Change in
(deg) Angle of psi(i) axis to hinge axis
(deg) Angle of psi(i) axis to hinge axis
(deg) Percentage Progress
TYR-195
GLN-196
6.0
6.0
-4.6
-0.2
57.4
57.3
61.7
GLN-196
PHE-197
6.0
5.9
-2.0
0.6
39.2
41.1
-21.7
PHE-197
GLY-198
4.2
4.0
-7.9
6.0
51.2
52.0
-10.2
GLY-198
THR-199
6.0
5.8
-9.7
8.4
20.1
19.0
16.9
THR-199
GLU-200
6.7
6.5
-23.2
32.6
74.2
71.3
-29.0
GLU-200
PRO-201
8.9
8.7
10.7
-16.4
167.4
158.8
56.7
PRO-201
PHE-202
9.7
10.0
-22.0
6.4
60.8
55.4
4.1

Graph shows rotational transition at bending residues and can be used
to identify hinge bending residues.
Probably only informative for interdomain rotations greater than 20 degrees
Residue
iResidue
i+1Distance of hinge axis to residue i in
(A) Distance of hinge axis to residue i in
(A) Change in
(deg) Change in
(deg) Angle of psi(i) axis to hinge axis
(deg) Angle of psi(i) axis to hinge axis
(deg) Percentage Progress
THR-214
ALA-215
5.1
5.3
2.2
-3.1
95.5
97.2
-52.2
ALA-215
SER-216
1.7
1.9
-8.1
2.0
11.9
12.1
98.6
SER-216
ILE-217
0.7
0.9
1.5
-0.9
99.1
98.6
0.0

Graph shows rotational transition at bending residues and can be used
to identify hinge bending residues.
Probably only informative for interdomain rotations greater than 20 degrees