Nad-Dependent Deacetylase Sirtuin-5
(All numbering and residues are taken from first PDB file)
![]()
![]()
Bending Residue Dihedral Analysis
Residue
iResidue
i+1Distance of hinge axis to residue i in
(A) Distance of hinge axis to residue i in
(A) Change in
(deg) Change in
(deg) Angle of psi(i) axis to hinge axis
(deg) Angle of psi(i) axis to hinge axis
(deg) Percentage Progress
GLU-64
SER-65
4.6
4.6
1.7
0.3
91.1
89.3
14.4
SER-65
GLY-66
1.8
1.7
1.0
18.4
89.9
87.9
-36.4
GLY-66
VAL-67
5.6
5.4
-19.0
2.9
24.4
24.0
129.6
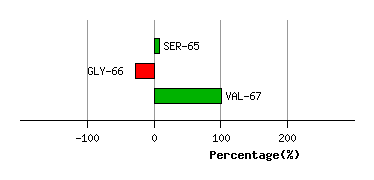
Graph shows rotational transition at bending residues and can be used
to identify hinge bending residues.
Probably only informative for interdomain rotations greater than 20 degrees
Residue
iResidue
i+1Distance of hinge axis to residue i in
(A) Distance of hinge axis to residue i in
(A) Change in
(deg) Change in
(deg) Angle of psi(i) axis to hinge axis
(deg) Angle of psi(i) axis to hinge axis
(deg) Percentage Progress
GLU-107
VAL-108
12.6
12.7
4.6
-7.2
143.6
147.3
-9.8
GLY-110
SER-111
10.1
9.9
-3.6
-17.4
8.8
22.4
98.0
SER-111
LYS-112
9.5
9.3
19.1
12.2
108.9
106.9
-79.1
LYS-112
GLU-113
5.6
5.5
4.9
-11.0
94.6
89.8
-6.9

Graph shows rotational transition at bending residues and can be used
to identify hinge bending residues.
Probably only informative for interdomain rotations greater than 20 degrees
Residue
iResidue
i+1Distance of hinge axis to residue i in
(A) Distance of hinge axis to residue i in
(A) Change in
(deg) Change in
(deg) Angle of psi(i) axis to hinge axis
(deg) Angle of psi(i) axis to hinge axis
(deg) Percentage Progress
ILE-157
HIS-158
5.3
5.4
2.5
-5.9
102.3
104.5
3.4
HIS-158
GLY-159
3.1
3.3
0.2
3.6
91.0
90.2
-4.2
GLY-159
SER-160
0.8
0.5
-0.3
13.1
158.7
155.4
65.8
SER-160
LEU-161
3.3
3.1
0.4
-5.0
89.5
81.6
50.3

Graph shows rotational transition at bending residues and can be used
to identify hinge bending residues.
Probably only informative for interdomain rotations greater than 20 degrees
Residue
iResidue
i+1Distance of hinge axis to residue i in
(A) Distance of hinge axis to residue i in
(A) Change in
(deg) Change in
(deg) Angle of psi(i) axis to hinge axis
(deg) Angle of psi(i) axis to hinge axis
(deg) Percentage Progress
ASN-226
LEU-227
7.0
7.4
-13.8
5.4
54.8
54.9
34.7
LEU-227
ASP-228
5.6
5.9
3.3
7.6
49.5
47.6
59.0
ASP-228
PRO-229
4.3
4.5
7.2
-4.3
77.8
73.6
-10.8
PRO-229
ALA-230
7.6
7.6
0.5
-5.0
108.5
110.1
38.6

Graph shows rotational transition at bending residues and can be used
to identify hinge bending residues.
Probably only informative for interdomain rotations greater than 20 degrees