Lipopolysaccharide Heptosyltransferase 1
(All numbering and residues are taken from first PDB file)
![]()
![]()
Bending Residue Dihedral Analysis
Residue
iResidue
i+1Distance of hinge axis to residue i in
(A) Distance of hinge axis to residue i in
(A) Change in
(deg) Change in
(deg) Angle of psi(i) axis to hinge axis
(deg) Angle of psi(i) axis to hinge axis
(deg) Percentage Progress
ALA-181
VAL-182
9.6
9.7
3.5
1.0
111.8
110.6
-48.9
VAL-182
PHE-183
6.5
6.4
6.8
-5.2
50.3
46.0
87.8
PHE-183
LEU-184
4.1
4.1
2.8
-2.1
121.2
119.6
18.3

Graph shows rotational transition at bending residues and can be used
to identify hinge bending residues.
Probably only informative for interdomain rotations greater than 20 degrees
Residue
iResidue
i+1Distance of hinge axis to residue i in
(A) Distance of hinge axis to residue i in
(A) Change in
(deg) Change in
(deg) Angle of psi(i) axis to hinge axis
(deg) Angle of psi(i) axis to hinge axis
(deg) Percentage Progress
HIS-193
TRP-194
10.0
10.0
5.0
-5.7
153.0
152.0
20.1
TRP-194
PRO-195
7.4
7.3
-4.3
3.3
80.5
81.9
-17.3
PRO-195
GLU-196
7.0
6.8
-1.2
-2.5
105.4
106.5
47.1
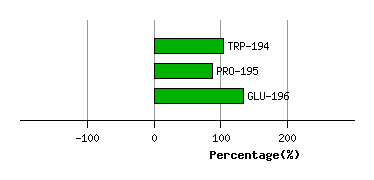
Graph shows rotational transition at bending residues and can be used
to identify hinge bending residues.
Probably only informative for interdomain rotations greater than 20 degrees
Residue
iResidue
i+1Distance of hinge axis to residue i in
(A) Distance of hinge axis to residue i in
(A) Change in
(deg) Change in
(deg) Angle of psi(i) axis to hinge axis
(deg) Angle of psi(i) axis to hinge axis
(deg) Percentage Progress
LYS-214
LEU-215
5.7
5.7
1.0
-1.7
82.8
82.1
7.2
LEU-215
PRO-216
2.1
2.1
12.1
-10.1
146.6
146.8
-52.6
PRO-216
TRP-217
0.3
0.6
-8.0
12.8
102.0
101.0
56.7
TRP-217
GLY-218
4.0
4.3
14.9
-27.1
151.8
154.7
426.0
GLY-218
ALA-219
6.6
6.6
12.9
-13.2
98.5
93.8
-194.3
ALA-219
PRO-220
9.7
10.0
-1.1
-2.9
117.6
125.4
-155.2
PRO-220
HIS-221
11.4
11.8
3.7
0.8
1.3
7.7
191.2
HIS-221
GLU-222
11.9
11.9
-3.7
2.3
111.7
106.9
-56.9
GLU-222
GLU-223
8.3
8.2
-7.3
2.9
86.3
88.4
-92.4
GLU-223
GLU-224
7.8
8.0
1.4
2.8
39.8
36.4
114.3
GLU-224
ARG-225
10.4
10.5
-5.5
1.7
30.5
35.7
166.2
GLU-224
ARG-225
10.4
10.5
-5.5
1.7
30.5
35.7
166.2

Graph shows rotational transition at bending residues and can be used
to identify hinge bending residues.
Probably only informative for interdomain rotations greater than 20 degrees
Residue
iResidue
i+1Distance of hinge axis to residue i in
(A) Distance of hinge axis to residue i in
(A) Change in
(deg) Change in
(deg) Angle of psi(i) axis to hinge axis
(deg) Angle of psi(i) axis to hinge axis
(deg) Percentage Progress
GLU-224
ARG-225
10.4
10.5
-5.5
1.7
30.5
35.7
166.2
GLU-224
ARG-225
10.4
10.5
-5.5
1.7
30.5
35.7
166.2
ARG-225
ALA-226
8.2
8.0
-0.8
3.3
91.2
95.4
68.4
ALA-226
LYS-227
5.5
5.4
-6.4
1.4
78.1
75.4
33.2
LYS-227
ARG-228
8.8
8.7
2.3
-2.8
172.4
172.0
39.6
ARG-228
LEU-229
9.1
9.0
3.0
0.2
118.4
116.7
-129.8

Graph shows rotational transition at bending residues and can be used
to identify hinge bending residues.
Probably only informative for interdomain rotations greater than 20 degrees
Residue
iResidue
i+1Distance of hinge axis to residue i in
(A) Distance of hinge axis to residue i in
(A) Change in
(deg) Change in
(deg) Angle of psi(i) axis to hinge axis
(deg) Angle of psi(i) axis to hinge axis
(deg) Percentage Progress
ASN-275
ILE-276
13.7
13.6
-1.0
7.2
150.4
151.6
269.8
ILE-276
THR-277
12.7
12.7
8.1
-7.6
97.9
97.2
-95.9
THR-277
VAL-278
12.4
12.3
-0.4
3.2
152.5
153.8
87.2

Graph shows rotational transition at bending residues and can be used
to identify hinge bending residues.
Probably only informative for interdomain rotations greater than 20 degrees
Residue
iResidue
i+1Distance of hinge axis to residue i in
(A) Distance of hinge axis to residue i in
(A) Change in
(deg) Change in
(deg) Angle of psi(i) axis to hinge axis
(deg) Angle of psi(i) axis to hinge axis
(deg) Percentage Progress
LEU-286
ILE-287
24.7
24.6
-6.0
0.4
146.5
146.7
-214.3
ILE-287
GLY-288
21.6
21.6
9.0
-14.7
90.4
88.7
56.6
GLY-288
GLY-289
20.1
19.8
11.2
-6.7
32.0
32.8
161.7
GLY-289
TYR-290
19.0
18.9
-18.9
25.0
84.7
86.7
-70.9
GLY-289
TYR-290
19.0
18.9
-18.9
25.0
84.7
86.7
-70.9

Graph shows rotational transition at bending residues and can be used
to identify hinge bending residues.
Probably only informative for interdomain rotations greater than 20 degrees
Residue
iResidue
i+1Distance of hinge axis to residue i in
(A) Distance of hinge axis to residue i in
(A) Change in
(deg) Change in
(deg) Angle of psi(i) axis to hinge axis
(deg) Angle of psi(i) axis to hinge axis
(deg) Percentage Progress
GLY-289
TYR-290
19.0
18.9
-18.9
25.0
84.7
86.7
-70.9
GLY-289
TYR-290
19.0
18.9
-18.9
25.0
84.7
86.7
-70.9
TYR-290
GLY-291
21.5
21.6
-5.1
28.7
68.2
71.8
-151.6
GLY-291
LYS-292
21.7
21.4
163.4
157.5
49.4
60.1
-1214.7
LYS-292
ASN-293
21.9
23.0
-175.5
-166.2
124.8
119.2
831.8
ASN-293
GLN-294
19.9
20.1
-9.8
-1.5
101.3
103.2
438.6
GLN-294
MET-295
18.2
18.1
-11.4
17.4
166.4
166.0
277.6
MET-295
VAL-296
17.4
17.3
12.0
-22.3
74.7
73.3
-168.1
VAL-296
CYS-297
17.0
16.9
-12.8
15.5
149.7
154.2
69.0
CYS-297
ARG-298
14.4
14.3
10.0
-4.0
76.4
73.7
229.8

Graph shows rotational transition at bending residues and can be used
to identify hinge bending residues.
Probably only informative for interdomain rotations greater than 20 degrees