Glutamate Dehydrogenase
(All numbering and residues are taken from first PDB file)
![]()
![]()
Bending Residue Dihedral Analysis
Residue
iResidue
i+1Distance of hinge axis to residue i in
(A) Distance of hinge axis to residue i in
(A) Change in
(deg) Change in
(deg) Angle of psi(i) axis to hinge axis
(deg) Angle of psi(i) axis to hinge axis
(deg) Percentage Progress
ASP-4
PRO-5
24.1
24.2
-19.6
28.3
123.0
119.8
96.8
PRO-5
PHE-6
21.8
21.8
-15.1
4.8
83.3
76.9
114.0
PHE-6
GLU-7
19.9
20.0
-6.6
2.4
25.0
21.8
-29.5
GLU-7
ILE-8
19.9
20.1
-7.7
7.1
87.8
89.4
78.9
ILE-8
ALA-9
18.6
19.0
4.3
-3.0
75.4
74.6
63.5
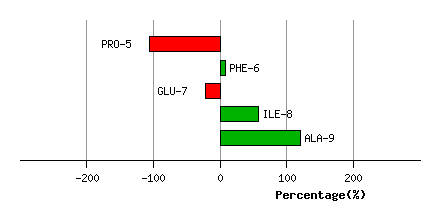
Graph shows rotational transition at bending residues and can be used
to identify hinge bending residues.
Probably only informative for interdomain rotations greater than 20 degrees
Residue
iResidue
i+1Distance of hinge axis to residue i in
(A) Distance of hinge axis to residue i in
(A) Change in
(deg) Change in
(deg) Angle of psi(i) axis to hinge axis
(deg) Angle of psi(i) axis to hinge axis
(deg) Percentage Progress
VAL-10
LYS-11
14.9
14.9
0.1
1.2
45.8
43.0
18.8
LYS-11
GLN-12
14.5
14.7
4.4
-11.7
111.1
106.8
124.5
GLN-12
LEU-13
12.7
12.8
0.5
10.8
79.8
81.3
14.6
LEU-13
GLU-14
9.9
10.0
-7.5
8.7
162.3
164.4
58.3
GLU-14
ARG-15
10.1
10.3
-14.0
13.8
112.9
112.2
-62.6
ARG-15
ALA-16
9.7
10.0
-15.5
2.5
70.8
75.2
-135.0
ARG-15
ALA-16
9.7
10.0
-15.5
2.5
70.8
75.2
-135.0

Graph shows rotational transition at bending residues and can be used
to identify hinge bending residues.
Probably only informative for interdomain rotations greater than 20 degrees
Residue
iResidue
i+1Distance of hinge axis to residue i in
(A) Distance of hinge axis to residue i in
(A) Change in
(deg) Change in
(deg) Angle of psi(i) axis to hinge axis
(deg) Angle of psi(i) axis to hinge axis
(deg) Percentage Progress
ARG-15
ALA-16
9.7
10.0
-15.5
2.5
70.8
75.2
-135.0
ARG-15
ALA-16
9.7
10.0
-15.5
2.5
70.8
75.2
-135.0
ALA-16
ALA-17
6.7
7.1
12.0
-14.0
57.5
68.7
-117.5
ALA-17
GLN-18
5.2
5.2
31.0
-20.7
45.9
33.3
395.3
GLN-18
TYR-19
5.1
5.1
-6.4
9.3
80.3
79.1
-144.0

Graph shows rotational transition at bending residues and can be used
to identify hinge bending residues.
Probably only informative for interdomain rotations greater than 20 degrees
Residue
iResidue
i+1Distance of hinge axis to residue i in
(A) Distance of hinge axis to residue i in
(A) Change in
(deg) Change in
(deg) Angle of psi(i) axis to hinge axis
(deg) Angle of psi(i) axis to hinge axis
(deg) Percentage Progress
GLY-181
GLY-182
8.2
8.3
-0.5
-11.3
57.4
56.0
213.7
GLY-182
ILE-183
8.5
8.4
-11.4
14.9
97.9
105.3
63.8
ILE-183
VAL-184
6.6
6.5
-12.8
18.6
86.7
86.9
-37.2
VAL-184
ALA-185
8.4
8.7
-16.5
30.7
133.5
136.1
400.2
VAL-184
ALA-185
8.4
8.7
-16.5
30.7
133.5
136.1
400.2

Graph shows rotational transition at bending residues and can be used
to identify hinge bending residues.
Probably only informative for interdomain rotations greater than 20 degrees
Residue
iResidue
i+1Distance of hinge axis to residue i in
(A) Distance of hinge axis to residue i in
(A) Change in
(deg) Change in
(deg) Angle of psi(i) axis to hinge axis
(deg) Angle of psi(i) axis to hinge axis
(deg) Percentage Progress
VAL-184
ALA-185
8.4
8.7
-16.5
30.7
133.5
136.1
400.2
VAL-184
ALA-185
8.4
8.7
-16.5
30.7
133.5
136.1
400.2
ALA-185
ARG-186
9.2
9.3
-33.0
31.6
144.5
140.8
-154.8
ARG-186
MET-187
9.7
9.8
-10.4
10.8
99.0
98.0
-137.2
MET-187
ASP-188
13.4
13.4
-6.3
-1.7
48.5
46.1
126.6
MET-187
ASP-188
13.4
13.4
-6.3
-1.7
48.5
46.1
126.6

Graph shows rotational transition at bending residues and can be used
to identify hinge bending residues.
Probably only informative for interdomain rotations greater than 20 degrees
Residue
iResidue
i+1Distance of hinge axis to residue i in
(A) Distance of hinge axis to residue i in
(A) Change in
(deg) Change in
(deg) Angle of psi(i) axis to hinge axis
(deg) Angle of psi(i) axis to hinge axis
(deg) Percentage Progress
MET-187
ASP-188
13.4
13.4
-6.3
-1.7
48.5
46.1
126.6
MET-187
ASP-188
13.4
13.4
-6.3
-1.7
48.5
46.1
126.6
ASP-188
ALA-189
14.3
14.3
2.1
1.9
141.3
139.1
16.0
ALA-189
THR-190
11.2
11.3
2.0
1.1
156.2
159.4
-236.1

Graph shows rotational transition at bending residues and can be used
to identify hinge bending residues.
Probably only informative for interdomain rotations greater than 20 degrees
Residue
iResidue
i+1Distance of hinge axis to residue i in
(A) Distance of hinge axis to residue i in
(A) Change in
(deg) Change in
(deg) Angle of psi(i) axis to hinge axis
(deg) Angle of psi(i) axis to hinge axis
(deg) Percentage Progress
VAL-347
THR-348
7.3
7.2
14.5
-13.6
110.6
104.5
27.3
THR-348
VAL-349
4.3
4.2
11.7
-8.6
170.3
170.6
-42.6
VAL-349
SER-350
5.2
5.2
-6.4
7.3
75.0
74.3
-109.2

Graph shows rotational transition at bending residues and can be used
to identify hinge bending residues.
Probably only informative for interdomain rotations greater than 20 degrees
Residue
iResidue
i+1Distance of hinge axis to residue i in
(A) Distance of hinge axis to residue i in
(A) Change in
(deg) Change in
(deg) Angle of psi(i) axis to hinge axis
(deg) Angle of psi(i) axis to hinge axis
(deg) Percentage Progress
GLY-360
ASP-361
8.3
8.3
3.0
-6.0
70.2
68.2
-100.2
ASP-361
TYR-362
5.8
5.9
-8.7
7.7
77.4
74.1
150.7
TYR-362
TRP-363
2.1
2.2
16.1
-14.6
87.3
90.5
40.9

Graph shows rotational transition at bending residues and can be used
to identify hinge bending residues.
Probably only informative for interdomain rotations greater than 20 degrees
Residue
iResidue
i+1Distance of hinge axis to residue i in
(A) Distance of hinge axis to residue i in
(A) Change in
(deg) Change in
(deg) Angle of psi(i) axis to hinge axis
(deg) Angle of psi(i) axis to hinge axis
(deg) Percentage Progress
LYS-371
LEU-372
7.4
7.3
13.1
-21.3
47.2
47.0
-156.9
LEU-372
ASP-373
7.3
7.3
18.5
-19.2
52.3
51.0
-41.0
ASP-373
LYS-374
10.8
10.6
21.3
-14.3
45.6
43.8
241.2
LYS-374
LYS-375
10.1
9.9
2.9
-0.7
42.4
40.9
-29.1
LYS-375
MET-376
6.8
6.7
-5.6
11.5
131.9
126.0
206.6
MET-376
THR-377
8.8
9.0
-1.2
-12.0
123.8
124.5
-329.1
THR-377
LYS-378
11.6
11.6
-0.9
3.8
143.1
142.1
-25.6
LYS-378
ALA-379
9.7
9.9
14.7
-12.3
45.1
44.7
110.9

Graph shows rotational transition at bending residues and can be used
to identify hinge bending residues.
Probably only informative for interdomain rotations greater than 20 degrees
Residue
iResidue
i+1Distance of hinge axis to residue i in
(A) Distance of hinge axis to residue i in
(A) Change in
(deg) Change in
(deg) Angle of psi(i) axis to hinge axis
(deg) Angle of psi(i) axis to hinge axis
(deg) Percentage Progress
VAL-401
ALA-402
2.3
2.6
-5.6
-0.3
59.9
62.3
270.8
ALA-402
VAL-403
2.2
1.9
3.9
-0.7
56.8
58.9
14.9
VAL-403
SER-404
3.6
3.5
-3.5
5.3
103.4
101.6
-53.1

Graph shows rotational transition at bending residues and can be used
to identify hinge bending residues.
Probably only informative for interdomain rotations greater than 20 degrees