Hla Class II Histocompatibility Antigen, Dr-1 Beta Chain
(All numbering and residues are taken from first PDB file)
![]()
![]()
Bending Residue Dihedral Analysis
Residue
iResidue
i+1Distance of hinge axis to residue i in
(A) Distance of hinge axis to residue i in
(A) Change in
(deg) Change in
(deg) Angle of psi(i) axis to hinge axis
(deg) Angle of psi(i) axis to hinge axis
(deg) Percentage Progress
GLN-92
ARG-93
8.1
7.8
11.2
-10.2
64.3
65.1
72.4
ARG-93
ARG-94
5.0
4.9
-2.9
1.6
114.2
109.0
-8.2
ARG-94
VAL-95
5.6
5.4
-14.6
11.3
106.5
107.0
15.3
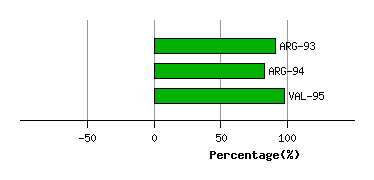
Graph shows rotational transition at bending residues and can be used
to identify hinge bending residues.
Probably only informative for interdomain rotations greater than 20 degrees
Residue
iResidue
i+1Distance of hinge axis to residue i in
(A) Distance of hinge axis to residue i in
(A) Change in
(deg) Change in
(deg) Angle of psi(i) axis to hinge axis
(deg) Angle of psi(i) axis to hinge axis
(deg) Percentage Progress
SER-118
VAL-119
13.9
13.7
10.0
1.0
18.2
15.9
113.4
VAL-119
SER-120
12.1
11.9
11.0
-5.0
93.2
92.4
22.1
SER-120
GLY-121
8.6
8.7
-8.8
9.1
148.5
151.0
-0.6
GLY-121
PHE-122
5.7
5.9
-2.8
0.1
143.5
142.0
-35.4
PHE-122
TYR-123
6.7
6.5
10.7
-10.7
83.3
85.1
-0.6

Graph shows rotational transition at bending residues and can be used
to identify hinge bending residues.
Probably only informative for interdomain rotations greater than 20 degrees
Residue
iResidue
i+1Distance of hinge axis to residue i in
(A) Distance of hinge axis to residue i in
(A) Change in
(deg) Change in
(deg) Angle of psi(i) axis to hinge axis
(deg) Angle of psi(i) axis to hinge axis
(deg) Percentage Progress
GLY-146
LEU-147
12.5
12.7
12.9
-0.8
44.8
55.2
84.7
LEU-147
ILE-148
10.6
10.2
7.7
-10.9
108.8
116.6
16.7
ILE-148
GLN-149
6.9
6.6
0.2
0.7
43.7
45.0
25.0

Graph shows rotational transition at bending residues and can be used
to identify hinge bending residues.
Probably only informative for interdomain rotations greater than 20 degrees
Residue
iResidue
i+1Distance of hinge axis to residue i in
(A) Distance of hinge axis to residue i in
(A) Change in
(deg) Change in
(deg) Angle of psi(i) axis to hinge axis
(deg) Angle of psi(i) axis to hinge axis
(deg) Percentage Progress
PHE-155
GLN-156
5.2
5.0
-2.6
13.2
108.1
109.3
13.0
GLN-156
THR-157
7.3
7.1
-1.8
6.8
129.8
124.9
59.3
THR-157
LEU-158
10.3
10.3
8.8
-22.1
75.2
72.8
-39.3
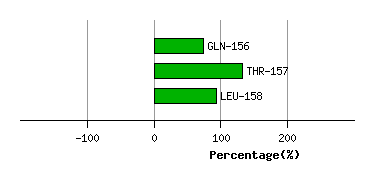
Graph shows rotational transition at bending residues and can be used
to identify hinge bending residues.
Probably only informative for interdomain rotations greater than 20 degrees