Actin, Cytoplasmic 1
(All numbering and residues are taken from first PDB file)
![]()
![]()
Bending Residue Dihedral Analysis
Residue
iResidue
i+1Distance of hinge axis to residue i in
(A) Distance of hinge axis to residue i in
(A) Change in
(deg) Change in
(deg) Angle of psi(i) axis to hinge axis
(deg) Angle of psi(i) axis to hinge axis
(deg) Percentage Progress
THR-106
GLU-107
2.1
2.6
-7.3
11.4
128.2
126.3
10.1
GLU-107
ALA-108
2.6
2.9
-10.5
7.8
51.5
53.8
7.7
ALA-108
PRO-109
6.0
6.2
1.4
0.7
90.9
90.0
62.6
PRO-109
LEU-110
7.8
8.1
-3.3
-2.1
33.2
34.2
35.6
PRO-109
LEU-110
7.8
8.1
-3.3
-2.1
33.2
34.2
35.6

Graph shows rotational transition at bending residues and can be used
to identify hinge bending residues.
Probably only informative for interdomain rotations greater than 20 degrees
Residue
iResidue
i+1Distance of hinge axis to residue i in
(A) Distance of hinge axis to residue i in
(A) Change in
(deg) Change in
(deg) Angle of psi(i) axis to hinge axis
(deg) Angle of psi(i) axis to hinge axis
(deg) Percentage Progress
PRO-109
LEU-110
7.8
8.1
-3.3
-2.1
33.2
34.2
35.6
PRO-109
LEU-110
7.8
8.1
-3.3
-2.1
33.2
34.2
35.6
LEU-110
ASN-111
9.8
10.1
7.5
-18.1
140.7
144.4
66.4
ASN-111
PRO-112
7.2
7.4
4.6
5.6
146.0
138.7
-11.2

Graph shows rotational transition at bending residues and can be used
to identify hinge bending residues.
Probably only informative for interdomain rotations greater than 20 degrees
Residue
iResidue
i+1Distance of hinge axis to residue i in
(A) Distance of hinge axis to residue i in
(A) Change in
(deg) Change in
(deg) Angle of psi(i) axis to hinge axis
(deg) Angle of psi(i) axis to hinge axis
(deg) Percentage Progress
GLN-137
ALA-138
2.0
2.4
4.8
-13.1
153.6
151.3
30.9
ALA-138
VAL-139
4.0
4.4
1.4
1.1
114.1
110.4
-40.7
VAL-139
LEU-140
4.2
4.3
3.4
-0.5
117.7
113.2
25.7

Graph shows rotational transition at bending residues and can be used
to identify hinge bending residues.
Probably only informative for interdomain rotations greater than 20 degrees
Residue
iResidue
i+1Distance of hinge axis to residue i in
(A) Distance of hinge axis to residue i in
(A) Change in
(deg) Change in
(deg) Angle of psi(i) axis to hinge axis
(deg) Angle of psi(i) axis to hinge axis
(deg) Percentage Progress
TYR-337
SER-338
8.1
8.4
4.2
-20.1
99.6
88.3
85.1
SER-338
VAL-339
4.3
4.7
20.1
2.7
151.0
152.7
-57.7
VAL-339
TRP-340
3.7
3.7
-1.8
6.8
72.7
72.7
40.8
TRP-340
ILE-341
6.7
6.7
-9.1
0.3
128.3
123.5
-55.1
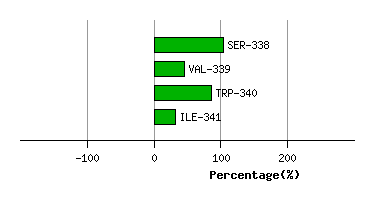
Graph shows rotational transition at bending residues and can be used
to identify hinge bending residues.
Probably only informative for interdomain rotations greater than 20 degrees