Aspartate Aminotransferase
(All numbering and residues are taken from first PDB file)
![]()
![]()
Bending Residue Dihedral Analysis
Residue
iResidue
i+1Distance of hinge axis to residue i in
(A) Distance of hinge axis to residue i in
(A) Change in
(deg) Change in
(deg) Angle of psi(i) axis to hinge axis
(deg) Angle of psi(i) axis to hinge axis
(deg) Percentage Progress
LYS-32
ILE-33
17.7
18.0
1.3
-5.3
79.7
95.3
150.0
ILE-33
ASN-34
14.0
14.3
9.9
-18.3
127.3
123.1
63.1
ASN-34
LEU-35
12.9
12.6
4.1
-21.2
106.6
107.4
6.3
LEU-35
GLY-36
9.7
9.9
10.4
8.9
122.6
127.8
-55.7
GLY-36
ILE-37
11.2
11.6
-103.0
-1.5
119.9
98.6
-564.9

Graph shows rotational transition at bending residues and can be used
to identify hinge bending residues.
Probably only informative for interdomain rotations greater than 20 degrees
Residue
iResidue
i+1Distance of hinge axis to residue i in
(A) Distance of hinge axis to residue i in
(A) Change in
(deg) Change in
(deg) Angle of psi(i) axis to hinge axis
(deg) Angle of psi(i) axis to hinge axis
(deg) Percentage Progress
GLY-38
VAL-39
9.7
8.7
118.6
-31.2
35.7
25.4
1081.9
VAL-39
TYR-40
9.3
8.7
-29.9
13.7
109.6
111.2
37.4
TYR-40
LYS-41
6.0
5.6
-7.3
9.0
137.6
135.1
20.5
LYS-41
ASP-42
5.2
4.9
-0.2
4.5
111.8
115.7
-57.5

Graph shows rotational transition at bending residues and can be used
to identify hinge bending residues.
Probably only informative for interdomain rotations greater than 20 degrees
Residue
iResidue
i+1Distance of hinge axis to residue i in
(A) Distance of hinge axis to residue i in
(A) Change in
(deg) Change in
(deg) Angle of psi(i) axis to hinge axis
(deg) Angle of psi(i) axis to hinge axis
(deg) Percentage Progress
ARG-334
GLN-335
6.0
6.0
27.0
-6.4
85.3
80.2
165.5
GLN-335
LEU-336
9.7
9.6
3.2
-3.6
104.9
100.8
13.4
LEU-336
PHE-337
10.8
10.6
-18.2
17.1
131.2
132.0
24.4
PHE-337
VAL-338
9.9
9.8
5.5
-4.1
42.9
36.4
21.8

Graph shows rotational transition at bending residues and can be used
to identify hinge bending residues.
Probably only informative for interdomain rotations greater than 20 degrees
Residue
iResidue
i+1Distance of hinge axis to residue i in
(A) Distance of hinge axis to residue i in
(A) Change in
(deg) Change in
(deg) Angle of psi(i) axis to hinge axis
(deg) Angle of psi(i) axis to hinge axis
(deg) Percentage Progress
ASP-349
PHE-350
12.6
13.6
47.3
-17.5
71.5
78.9
75.4
PHE-350
SER-351
10.1
10.4
15.7
15.7
66.7
69.9
178.4
SER-351
PHE-352
10.6
10.9
-4.9
-8.2
77.7
84.6
-75.4
PHE-352
ILE-353
7.6
7.6
-4.7
12.8
142.7
137.5
92.9
ILE-353
ILE-354
5.8
5.6
-12.8
12.5
124.8
123.2
-100.3
ILE-354
LYS-355
8.3
7.8
-0.7
0.2
66.5
70.7
15.7
LYS-355
GLN-356
8.2
7.8
0.7
7.7
82.9
86.1
60.7
GLN-356
ASN-357
5.2
4.7
9.9
-11.1
23.0
31.2
-38.3
ASN-357
GLY-358
6.0
5.7
8.9
-2.5
67.0
63.6
93.5
GLY-358
MET-359
4.9
5.2
3.1
-2.6
81.0
72.0
-2.1
MET-359
PHE-360
2.9
3.1
16.5
-3.2
140.4
124.5
-107.5
PHE-360
SER-361
3.1
2.9
15.4
20.9
139.6
126.8
-365.2
SER-361
PHE-362
1.7
2.1
-16.1
-17.8
62.8
44.4
251.8

Graph shows rotational transition at bending residues and can be used
to identify hinge bending residues.
Probably only informative for interdomain rotations greater than 20 degrees
Residue
iResidue
i+1Distance of hinge axis to residue i in
(A) Distance of hinge axis to residue i in
(A) Change in
(deg) Change in
(deg) Angle of psi(i) axis to hinge axis
(deg) Angle of psi(i) axis to hinge axis
(deg) Percentage Progress
GLY-385
ARG-386
9.2
9.2
14.5
-10.6
49.8
52.6
94.5
ARG-386
VAL-387
7.1
7.1
-6.5
6.9
155.0
151.7
-51.0
VAL-387
ASN-388
6.6
6.8
-12.6
20.6
128.6
135.8
148.5
ASN-388
VAL-389
5.3
5.7
-10.3
-5.9
123.7
122.7
-115.5
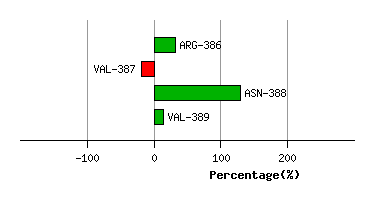
Graph shows rotational transition at bending residues and can be used
to identify hinge bending residues.
Probably only informative for interdomain rotations greater than 20 degrees