Glutamate Receptor, Ionotropic Kainate 1
(All numbering and residues are taken from first PDB file)
![]()
![]()
Bending Residue Dihedral Analysis
Residue
iResidue
i+1Distance of hinge axis to residue i in
(A) Distance of hinge axis to residue i in
(A) Change in
(deg) Change in
(deg) Angle of psi(i) axis to hinge axis
(deg) Angle of psi(i) axis to hinge axis
(deg) Percentage Progress
GLY-109
ILE-110
8.6
8.2
-39.2
28.7
80.2
74.7
33.0
ILE-110
SER-111
6.2
5.9
-4.8
-9.5
24.2
28.9
120.3
SER-111
ILE-112
5.8
5.9
8.3
-9.3
99.9
103.0
-20.1
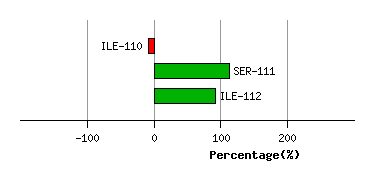
Graph shows rotational transition at bending residues and can be used
to identify hinge bending residues.
Probably only informative for interdomain rotations greater than 20 degrees
Residue
iResidue
i+1Distance of hinge axis to residue i in
(A) Distance of hinge axis to residue i in
(A) Change in
(deg) Change in
(deg) Angle of psi(i) axis to hinge axis
(deg) Angle of psi(i) axis to hinge axis
(deg) Percentage Progress
MET-189
GLU-190
1.6
1.4
23.8
-6.0
84.2
74.8
29.0
GLU-190
SER-191
3.3
3.3
17.8
-9.0
17.2
12.2
65.1
SER-191
THR-192
5.0
5.1
6.4
0.8
63.5
68.6
58.3

Graph shows rotational transition at bending residues and can be used
to identify hinge bending residues.
Probably only informative for interdomain rotations greater than 20 degrees
Residue
iResidue
i+1Distance of hinge axis to residue i in
(A) Distance of hinge axis to residue i in
(A) Change in
(deg) Change in
(deg) Angle of psi(i) axis to hinge axis
(deg) Angle of psi(i) axis to hinge axis
(deg) Percentage Progress
TYR-196
VAL-197
6.9
7.0
12.0
-14.6
115.6
116.3
24.5
VAL-197
THR-198
5.4
5.2
-6.9
-7.9
24.8
21.4
114.8
THR-198
GLN-199
3.1
2.9
14.8
-5.2
137.9
134.5
-77.1

Graph shows rotational transition at bending residues and can be used
to identify hinge bending residues.
Probably only informative for interdomain rotations greater than 20 degrees
Residue
iResidue
i+1Distance of hinge axis to residue i in
(A) Distance of hinge axis to residue i in
(A) Change in
(deg) Change in
(deg) Angle of psi(i) axis to hinge axis
(deg) Angle of psi(i) axis to hinge axis
(deg) Percentage Progress
GLN-206
ILE-207
3.8
4.2
12.3
1.7
81.5
79.4
66.6
ILE-207
GLY-208
7.5
7.7
-12.1
-18.0
47.3
52.7
211.2
GLY-208
GLY-209
10.4
10.5
19.6
-25.9
102.3
110.1
-29.5
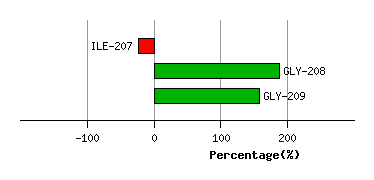
Graph shows rotational transition at bending residues and can be used
to identify hinge bending residues.
Probably only informative for interdomain rotations greater than 20 degrees