Penicillin-Binding Protein 2A
(All numbering and residues are taken from first PDB file)
![]()
![]()
Bending Residue Dihedral Analysis
Residue
iResidue
i+1Distance of hinge axis to residue i in
(A) Distance of hinge axis to residue i in
(A) Change in
(deg) Change in
(deg) Angle of psi(i) axis to hinge axis
(deg) Angle of psi(i) axis to hinge axis
(deg) Percentage Progress
PHE-395
GLN-396
10.9
11.2
-2.9
10.5
137.9
133.1
89.5
GLN-396
ILE-397
9.5
9.5
18.8
-13.1
65.8
69.9
65.0
ILE-397
THR-398
10.6
10.7
9.1
-21.0
127.6
128.9
174.8

Graph shows rotational transition at bending residues and can be used
to identify hinge bending residues.
Probably only informative for interdomain rotations greater than 20 degrees
Residue
iResidue
i+1Distance of hinge axis to residue i in
(A) Distance of hinge axis to residue i in
(A) Change in
(deg) Change in
(deg) Angle of psi(i) axis to hinge axis
(deg) Angle of psi(i) axis to hinge axis
(deg) Percentage Progress
LYS-406
ILE-407
15.5
15.3
5.9
-7.1
70.5
68.5
23.1
ILE-407
LEU-408
12.5
12.1
4.2
-1.3
134.7
134.8
102.9
LEU-408
THR-409
12.5
12.1
-6.6
8.9
87.4
88.6
-36.5

Graph shows rotational transition at bending residues and can be used
to identify hinge bending residues.
Probably only informative for interdomain rotations greater than 20 degrees
Residue
iResidue
i+1Distance of hinge axis to residue i in
(A) Distance of hinge axis to residue i in
(A) Change in
(deg) Change in
(deg) Angle of psi(i) axis to hinge axis
(deg) Angle of psi(i) axis to hinge axis
(deg) Percentage Progress
ILE-412
GLY-413
16.7
16.6
-13.1
13.4
61.6
60.9
-49.5
GLY-413
LEU-414
19.5
19.6
-3.1
1.3
46.5
47.7
40.0

Graph shows rotational transition at bending residues and can be used
to identify hinge bending residues.
Probably only informative for interdomain rotations greater than 20 degrees
Residue
iResidue
i+1Distance of hinge axis to residue i in
(A) Distance of hinge axis to residue i in
(A) Change in
(deg) Change in
(deg) Angle of psi(i) axis to hinge axis
(deg) Angle of psi(i) axis to hinge axis
(deg) Percentage Progress
GLY-487
VAL-488
8.3
8.3
14.9
-9.0
115.8
112.2
-87.2
VAL-488
GLY-489
8.8
8.8
0.0
-5.9
166.1
166.1
43.6
GLY-489
GLU-490
8.5
8.4
-10.2
16.0
60.9
65.7
1.6

Graph shows rotational transition at bending residues and can be used
to identify hinge bending residues.
Probably only informative for interdomain rotations greater than 20 degrees
Residue
iResidue
i+1Distance of hinge axis to residue i in
(A) Distance of hinge axis to residue i in
(A) Change in
(deg) Change in
(deg) Angle of psi(i) axis to hinge axis
(deg) Angle of psi(i) axis to hinge axis
(deg) Percentage Progress
PRO-497
PHE-498
6.1
6.3
5.9
-5.6
119.0
123.2
129.9
PHE-498
TYR-499
4.9
5.2
4.3
-8.8
55.2
55.6
-47.6
TYR-499
ASN-500
5.7
5.8
0.3
2.6
112.4
114.4
17.6

Graph shows rotational transition at bending residues and can be used
to identify hinge bending residues.
Probably only informative for interdomain rotations greater than 20 degrees
Residue
iResidue
i+1Distance of hinge axis to residue i in
(A) Distance of hinge axis to residue i in
(A) Change in
(deg) Change in
(deg) Angle of psi(i) axis to hinge axis
(deg) Angle of psi(i) axis to hinge axis
(deg) Percentage Progress
ASN-527
PRO-528
7.6
7.5
0.6
-1.8
10.4
8.8
20.1
PRO-528
VAL-529
7.9
8.0
11.1
-7.8
70.6
72.1
-27.9
VAL-529
GLN-530
4.7
4.7
-1.9
-1.7
89.7
87.8
-42.9
GLN-530
ILE-531
3.2
3.3
4.3
-1.7
37.4
37.4
50.7
ILE-531
LEU-532
5.9
5.8
-7.0
2.9
145.7
141.6
-112.1
LEU-532
SER-533
3.8
3.6
7.6
-19.2
89.1
90.3
45.6
LEU-532
SER-533
3.8
3.6
7.6
-19.2
89.1
90.3
45.6

Graph shows rotational transition at bending residues and can be used
to identify hinge bending residues.
Probably only informative for interdomain rotations greater than 20 degrees
Residue
iResidue
i+1Distance of hinge axis to residue i in
(A) Distance of hinge axis to residue i in
(A) Change in
(deg) Change in
(deg) Angle of psi(i) axis to hinge axis
(deg) Angle of psi(i) axis to hinge axis
(deg) Percentage Progress
LEU-532
SER-533
3.8
3.6
7.6
-19.2
89.1
90.3
45.6
LEU-532
SER-533
3.8
3.6
7.6
-19.2
89.1
90.3
45.6
SER-533
ILE-534
1.2
1.1
12.9
-5.6
68.5
76.2
46.9
ILE-534
TYR-535
4.9
4.9
1.4
0.0
4.6
3.6
110.1

Graph shows rotational transition at bending residues and can be used
to identify hinge bending residues.
Probably only informative for interdomain rotations greater than 20 degrees
Residue
iResidue
i+1Distance of hinge axis to residue i in
(A) Distance of hinge axis to residue i in
(A) Change in
(deg) Change in
(deg) Angle of psi(i) axis to hinge axis
(deg) Angle of psi(i) axis to hinge axis
(deg) Percentage Progress
SER-536
ALA-537
1.9
2.4
6.1
2.1
103.2
100.1
-107.1
ALA-537
LEU-538
5.7
6.3
-11.0
4.4
18.5
14.6
147.7
LEU-538
GLU-539
5.7
6.2
-10.3
4.5
52.5
55.9
46.3

Graph shows rotational transition at bending residues and can be used
to identify hinge bending residues.
Probably only informative for interdomain rotations greater than 20 degrees
Residue
iResidue
i+1Distance of hinge axis to residue i in
(A) Distance of hinge axis to residue i in
(A) Change in
(deg) Change in
(deg) Angle of psi(i) axis to hinge axis
(deg) Angle of psi(i) axis to hinge axis
(deg) Percentage Progress
ILE-544
ASN-545
6.4
6.7
-9.8
17.8
61.2
61.6
-209.9
ASN-545
ALA-546
6.7
7.0
14.2
-23.4
137.8
139.9
168.1
ALA-546
PRO-547
6.1
6.0
3.8
10.9
70.4
75.1
108.8
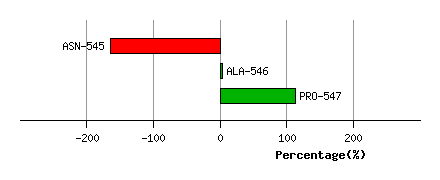
Graph shows rotational transition at bending residues and can be used
to identify hinge bending residues.
Probably only informative for interdomain rotations greater than 20 degrees
Residue
iResidue
i+1Distance of hinge axis to residue i in
(A) Distance of hinge axis to residue i in
(A) Change in
(deg) Change in
(deg) Angle of psi(i) axis to hinge axis
(deg) Angle of psi(i) axis to hinge axis
(deg) Percentage Progress
THR-553
LYS-554
14.2
14.1
-0.3
-1.8
46.0
40.6
45.2
LYS-554
ASN-555
14.8
14.6
12.5
-10.2
112.6
113.8
14.4
ASN-555
LYS-556
12.4
12.3
-29.0
25.1
109.1
105.3
68.2
LYS-556
VAL-557
11.8
11.8
-12.5
3.8
74.1
75.0
139.2
VAL-557
TRP-558
10.6
10.9
-28.5
19.3
144.2
146.8
-213.8
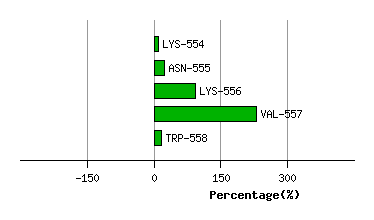
Graph shows rotational transition at bending residues and can be used
to identify hinge bending residues.
Probably only informative for interdomain rotations greater than 20 degrees
Residue
iResidue
i+1Distance of hinge axis to residue i in
(A) Distance of hinge axis to residue i in
(A) Change in
(deg) Change in
(deg) Angle of psi(i) axis to hinge axis
(deg) Angle of psi(i) axis to hinge axis
(deg) Percentage Progress
LEU-571
THR-572
11.6
11.6
5.2
-8.5
122.9
119.9
59.4
THR-572
ASP-573
8.6
8.4
1.4
-1.5
146.6
148.2
101.1
ASP-573
GLY-574
10.7
10.6
5.7
-8.6
74.9
78.4
29.0
GLN-576
GLN-577
9.3
9.2
-9.2
-0.3
63.4
70.3
229.3

Graph shows rotational transition at bending residues and can be used
to identify hinge bending residues.
Probably only informative for interdomain rotations greater than 20 degrees