Prfa
(All numbering and residues are taken from first PDB file)
![]()
![]()
Bending Residue Dihedral Analysis
Residue
iResidue
i+1Distance of hinge axis to residue i in
(A) Distance of hinge axis to residue i in
(A) Change in
(deg) Change in
(deg) Angle of psi(i) axis to hinge axis
(deg) Angle of psi(i) axis to hinge axis
(deg) Percentage Progress
LYS-130
PHE-131
2.6
2.2
-0.6
6.3
63.1
61.9
5.4
PHE-131
ASN-132
5.0
4.7
2.4
-8.3
93.1
91.2
33.5
ASN-132
ASP-133
5.4
5.2
5.2
-4.8
31.6
32.5
-23.0
ASP-133
PHE-134
6.1
6.0
-1.0
8.4
107.8
113.7
56.3

Graph shows rotational transition at bending residues and can be used
to identify hinge bending residues.
Probably only informative for interdomain rotations greater than 20 degrees
Residue
iResidue
i+1Distance of hinge axis to residue i in
(A) Distance of hinge axis to residue i in
(A) Change in
(deg) Change in
(deg) Angle of psi(i) axis to hinge axis
(deg) Angle of psi(i) axis to hinge axis
(deg) Percentage Progress
LEU-148
ILE-149
2.0
1.8
15.0
-13.7
76.0
72.7
-27.5
ILE-149
LEU-150
1.5
1.8
-9.7
26.5
32.2
31.1
-59.7
LEU-150
THR-151
3.2
3.4
-7.8
-5.2
47.5
53.1
49.2
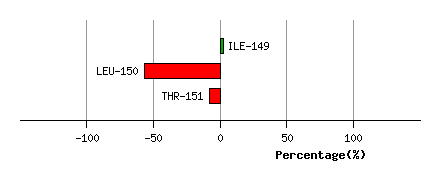
Graph shows rotational transition at bending residues and can be used
to identify hinge bending residues.
Probably only informative for interdomain rotations greater than 20 degrees
Residue
iResidue
i+1Distance of hinge axis to residue i in
(A) Distance of hinge axis to residue i in
(A) Change in
(deg) Change in
(deg) Angle of psi(i) axis to hinge axis
(deg) Angle of psi(i) axis to hinge axis
(deg) Percentage Progress
PRO-159
ASP-160
7.3
7.3
13.4
-4.8
107.7
98.7
6.2
ASP-160
GLY-161
5.2
4.8
1.6
-17.3
169.7
170.2
102.8
GLY-161
ILE-162
5.4
5.6
-3.2
10.9
63.4
64.3
-79.9
ILE-162
LYS-163
3.9
4.1
1.1
-6.3
89.2
83.2
25.0

Graph shows rotational transition at bending residues and can be used
to identify hinge bending residues.
Probably only informative for interdomain rotations greater than 20 degrees
Residue
iResidue
i+1Distance of hinge axis to residue i in
(A) Distance of hinge axis to residue i in
(A) Change in
(deg) Change in
(deg) Angle of psi(i) axis to hinge axis
(deg) Angle of psi(i) axis to hinge axis
(deg) Percentage Progress
ALA-185
VAL-186
19.8
20.4
64.0
-30.6
87.4
116.4
-363.6
VAL-186
SER-187
16.1
21.5
140.9
129.1
34.3
89.4
1319.9
SER-187
ARG-188
16.6
21.1
108.4
-13.8
90.5
72.7
-717.9
ARG-188
ILE-189
18.2
18.1
128.5
-15.2
109.2
85.8
-233.2
ILE-189
ILE-190
15.1
16.6
34.9
12.0
42.1
64.4
249.2
ILE-190
SER-191
12.9
13.4
7.9
-8.1
44.3
30.9
28.5
SER-191
LYS-192
15.6
15.5
0.6
-14.4
105.1
98.3
16.2
LYS-192
LEU-193
16.2
16.2
35.0
-4.0
78.6
101.3
5.9

Graph shows rotational transition at bending residues and can be used
to identify hinge bending residues.
Probably only informative for interdomain rotations greater than 20 degrees
Residue
iResidue
i+1Distance of hinge axis to residue i in
(A) Distance of hinge axis to residue i in
(A) Change in
(deg) Change in
(deg) Angle of psi(i) axis to hinge axis
(deg) Angle of psi(i) axis to hinge axis
(deg) Percentage Progress
ASN-203
SER-204
6.3
5.9
39.8
-0.6
37.8
33.3
272.4
SER-204
CYS-205
8.7
8.4
-33.3
-1.5
142.4
151.5
-307.5
CYS-205
PHE-206
5.7
5.5
9.6
-10.7
72.2
73.3
115.8
PHE-206
TYR-207
4.5
3.9
-4.0
11.8
85.5
86.2
-0.8
TYR-207
VAL-208
2.4
2.4
-4.7
8.6
122.1
133.2
-59.8

Graph shows rotational transition at bending residues and can be used
to identify hinge bending residues.
Probably only informative for interdomain rotations greater than 20 degrees
Residue
iResidue
i+1Distance of hinge axis to residue i in
(A) Distance of hinge axis to residue i in
(A) Change in
(deg) Change in
(deg) Angle of psi(i) axis to hinge axis
(deg) Angle of psi(i) axis to hinge axis
(deg) Percentage Progress
ASP-222
GLU-223
6.5
6.5
-2.1
5.6
124.9
119.6
34.1
GLU-223
TRP-224
8.4
8.8
-21.2
22.2
101.4
99.3
-52.4
TRP-224
PHE-225
6.6
7.1
2.5
-14.0
136.5
143.2
80.7

Graph shows rotational transition at bending residues and can be used
to identify hinge bending residues.
Probably only informative for interdomain rotations greater than 20 degrees