Rcd1 Required For Cell Differentiation1 Homolog
(All numbering and residues are taken from first PDB file)
![]()
![]()
Bending Residue Dihedral Analysis
Residue
iResidue
i+1Distance of hinge axis to residue i in
(A) Distance of hinge axis to residue i in
(A) Change in
(deg) Change in
(deg) Angle of psi(i) axis to hinge axis
(deg) Angle of psi(i) axis to hinge axis
(deg) Percentage Progress
VAL-55
ASN-56
11.6
11.5
3.7
10.0
158.7
154.9
-124.5
ASN-56
ILE-57
12.6
12.7
-32.2
11.2
58.7
58.3
120.8
ILE-57
TYR-58
9.2
9.7
15.1
6.0
71.9
63.9
130.7

Graph shows rotational transition at bending residues and can be used
to identify hinge bending residues.
Probably only informative for interdomain rotations greater than 20 degrees
Residue
iResidue
i+1Distance of hinge axis to residue i in
(A) Distance of hinge axis to residue i in
(A) Change in
(deg) Change in
(deg) Angle of psi(i) axis to hinge axis
(deg) Angle of psi(i) axis to hinge axis
(deg) Percentage Progress
LEU-66
THR-67
5.7
5.8
-10.9
20.9
140.4
140.0
86.6
THR-67
ALA-68
3.5
4.0
-8.5
7.7
71.2
72.4
-1.1
ALA-68
HIS-69
1.9
2.1
-5.3
5.7
77.7
73.5
-17.4
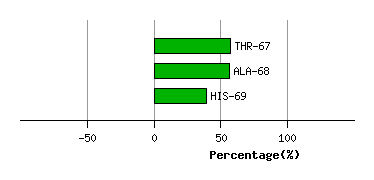
Graph shows rotational transition at bending residues and can be used
to identify hinge bending residues.
Probably only informative for interdomain rotations greater than 20 degrees
Residue
iResidue
i+1Distance of hinge axis to residue i in
(A) Distance of hinge axis to residue i in
(A) Change in
(deg) Change in
(deg) Angle of psi(i) axis to hinge axis
(deg) Angle of psi(i) axis to hinge axis
(deg) Percentage Progress
LEU-107
HIS-108
4.8
4.5
3.4
2.9
96.4
95.7
17.4
HIS-108
THR-109
8.4
8.1
-2.4
-1.0
21.5
20.2
31.6
THR-109
VAL-110
8.6
8.1
-0.9
-11.0
75.0
79.7
46.7

Graph shows rotational transition at bending residues and can be used
to identify hinge bending residues.
Probably only informative for interdomain rotations greater than 20 degrees
Residue
iResidue
i+1Distance of hinge axis to residue i in
(A) Distance of hinge axis to residue i in
(A) Change in
(deg) Change in
(deg) Angle of psi(i) axis to hinge axis
(deg) Angle of psi(i) axis to hinge axis
(deg) Percentage Progress
LEU-124
GLY-125
4.8
5.3
9.7
-7.9
108.9
106.3
-13.9
GLY-125
VAL-126
7.5
7.9
5.6
-6.4
134.3
134.6
-1.4
VAL-126
ILE-127
6.4
6.8
-6.2
11.1
24.0
26.0
-40.6

Graph shows rotational transition at bending residues and can be used
to identify hinge bending residues.
Probably only informative for interdomain rotations greater than 20 degrees
Residue
iResidue
i+1Distance of hinge axis to residue i in
(A) Distance of hinge axis to residue i in
(A) Change in
(deg) Change in
(deg) Angle of psi(i) axis to hinge axis
(deg) Angle of psi(i) axis to hinge axis
(deg) Percentage Progress
VAL-131
LYS-132
9.2
9.0
31.7
-1.5
90.2
89.9
-25.8
LYS-132
THR-133
12.7
12.6
-10.6
-21.0
138.0
152.9
-302.3
THR-133
ASP-134
13.0
13.3
25.5
-0.5
30.9
36.2
274.2
ASP-134
GLU-135
12.2
11.2
18.2
2.3
40.3
44.4
166.7
GLU-135
GLN-136
10.5
9.2
0.0
8.4
71.6
72.3
36.4
GLN-136
GLU-137
7.9
6.7
-22.7
-0.9
76.4
68.3
84.5
GLU-137
VAL-138
6.2
4.3
12.3
-1.2
141.7
162.1
-113.1
VAL-138
ILE-139
5.0
4.4
5.5
-4.3
84.2
94.7
4.3
ILE-139
ASN-140
5.0
4.8
-9.6
5.1
118.6
108.6
1.2
ASN-140
PHE-141
2.1
2.4
6.0
-1.3
126.3
128.4
-26.1
PHE-141
LEU-142
1.0
0.5
-3.1
-1.6
53.0
44.6
32.7

Graph shows rotational transition at bending residues and can be used
to identify hinge bending residues.
Probably only informative for interdomain rotations greater than 20 degrees