Actin, Alpha Skeletal Muscle
(All numbering and residues are taken from first PDB file)
![]()
![]()
Bending Residue Dihedral Analysis
Residue
iResidue
i+1Distance of hinge axis to residue i in
(A) Distance of hinge axis to residue i in
(A) Change in
(deg) Change in
(deg) Angle of psi(i) axis to hinge axis
(deg) Angle of psi(i) axis to hinge axis
(deg) Percentage Progress
ALA-6
ALA-7
11.0
11.2
-5.1
3.2
100.3
101.5
13.8
ALA-7
LEU-8
7.7
8.0
0.9
-2.9
59.4
62.0
14.6
LEU-8
VAL-9
5.6
5.7
-4.5
6.0
138.7
136.5
-27.9

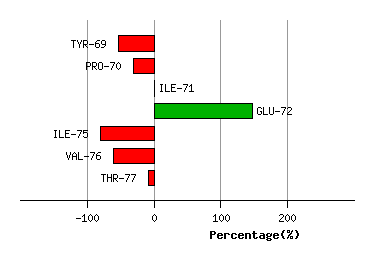
Graph shows rotational transition at bending residues and can be used
to identify hinge bending residues.
Probably only informative for interdomain rotations greater than 20 degrees
Residue
iResidue
i+1Distance of hinge axis to residue i in
(A) Distance of hinge axis to residue i in
(A) Change in
(deg) Change in
(deg) Angle of psi(i) axis to hinge axis
(deg) Angle of psi(i) axis to hinge axis
(deg) Percentage Progress
LYS-68
TYR-69
21.5
21.4
0.6
0.9
107.6
115.7
39.0
TYR-69
PRO-70
18.4
18.4
1.4
-15.0
71.0
69.4
22.3
PRO-70
ILE-71
16.5
16.6
16.2
-17.3
125.0
119.6
31.1
ILE-71
GLU-72
14.4
14.1
-85.4
76.3
27.0
18.1
147.2
GLY-74
ILE-75
11.5
11.9
-19.5
4.0
146.1
143.2
-200.2
ILE-75
VAL-76
13.6
13.5
-0.1
-1.7
135.3
137.6
19.8
VAL-76
THR-77
14.0
13.8
1.3
-5.4
79.8
72.1
52.2
Graph shows rotational transition at bending residues and can be used
to identify hinge bending residues.
Probably only informative for interdomain rotations greater than 20 degrees
Residue
iResidue
i+1Distance of hinge axis to residue i in
(A) Distance of hinge axis to residue i in
(A) Change in
(deg) Change in
(deg) Angle of psi(i) axis to hinge axis
(deg) Angle of psi(i) axis to hinge axis
(deg) Percentage Progress
ALA-97
PRO-98
8.1
8.3
-5.2
-9.1
65.9
67.6
49.0
PRO-98
GLU-99
4.6
4.8
8.1
-2.0
60.2
59.8
12.0
GLU-99
GLU-100
3.1
3.6
-0.1
1.3
86.0
84.5
26.2
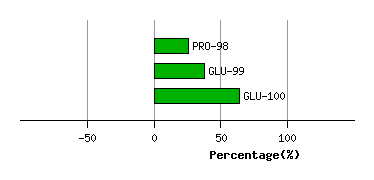
Graph shows rotational transition at bending residues and can be used
to identify hinge bending residues.
Probably only informative for interdomain rotations greater than 20 degrees
Residue
iResidue
i+1Distance of hinge axis to residue i in
(A) Distance of hinge axis to residue i in
(A) Change in
(deg) Change in
(deg) Angle of psi(i) axis to hinge axis
(deg) Angle of psi(i) axis to hinge axis
(deg) Percentage Progress
PRO-109
LEU-110
10.9
10.9
-1.8
8.1
72.2
72.9
9.1
LEU-110
ASN-111
14.5
14.5
-5.3
-9.6
43.1
28.9
148.7
ASN-111
PRO-112
13.5
13.7
-0.3
-8.4
54.7
56.2
76.7

Graph shows rotational transition at bending residues and can be used
to identify hinge bending residues.
Probably only informative for interdomain rotations greater than 20 degrees
Residue
iResidue
i+1Distance of hinge axis to residue i in
(A) Distance of hinge axis to residue i in
(A) Change in
(deg) Change in
(deg) Angle of psi(i) axis to hinge axis
(deg) Angle of psi(i) axis to hinge axis
(deg) Percentage Progress
ILE-122
MET-123
8.8
8.6
6.9
-5.6
80.5
83.0
-17.1
MET-123
PHE-124
5.1
4.9
1.1
2.6
26.6
25.5
37.4
PHE-124
GLU-125
5.5
5.2
1.2
-2.0
35.3
38.4
-0.5
GLU-125
THR-126
7.5
7.2
0.5
0.7
95.2
93.8
24.1
GLU-125
THR-126
7.5
7.2
0.5
0.7
95.2
93.8
24.1

Graph shows rotational transition at bending residues and can be used
to identify hinge bending residues.
Probably only informative for interdomain rotations greater than 20 degrees
Residue
iResidue
i+1Distance of hinge axis to residue i in
(A) Distance of hinge axis to residue i in
(A) Change in
(deg) Change in
(deg) Angle of psi(i) axis to hinge axis
(deg) Angle of psi(i) axis to hinge axis
(deg) Percentage Progress
GLU-125
THR-126
7.5
7.2
0.5
0.7
95.2
93.8
24.1
GLU-125
THR-126
7.5
7.2
0.5
0.7
95.2
93.8
24.1
THR-126
PHE-127
7.6
7.5
11.5
-13.5
91.4
89.7
2.7
PHE-127
ASN-128
4.5
4.5
-0.7
3.4
64.2
63.8
-20.5
ASN-128
THR-129
2.1
1.8
-3.0
-1.4
120.9
121.7
-25.6

Graph shows rotational transition at bending residues and can be used
to identify hinge bending residues.
Probably only informative for interdomain rotations greater than 20 degrees
Residue
iResidue
i+1Distance of hinge axis to residue i in
(A) Distance of hinge axis to residue i in
(A) Change in
(deg) Change in
(deg) Angle of psi(i) axis to hinge axis
(deg) Angle of psi(i) axis to hinge axis
(deg) Percentage Progress
SER-344
ILE-345
7.9
7.7
-0.7
3.5
96.3
97.9
53.3
ILE-345
LEU-346
10.4
10.1
5.8
-10.9
122.2
126.8
-30.9
LEU-346
ALA-347
9.7
9.5
-0.2
0.4
10.1
12.6
21.3
ALA-347
SER-348
9.0
8.7
-2.0
-4.1
75.3
74.4
-37.4
SER-348
LEU-349
12.3
12.0
17.0
-22.6
88.8
88.7
-20.3

Graph shows rotational transition at bending residues and can be used
to identify hinge bending residues.
Probably only informative for interdomain rotations greater than 20 degrees
Residue
iResidue
i+1Distance of hinge axis to residue i in
(A) Distance of hinge axis to residue i in
(A) Change in
(deg) Change in
(deg) Angle of psi(i) axis to hinge axis
(deg) Angle of psi(i) axis to hinge axis
(deg) Percentage Progress
PHE-352
GLN-353
13.6
15.9
42.7
-12.8
14.0
42.2
277.6
GLN-353
GLN-354
14.0
14.1
21.7
16.8
71.4
64.3
252.1
GLN-354
MET-355
15.3
15.4
-13.6
6.3
61.5
57.8
18.3
MET-355
TRP-356
13.1
13.5
16.1
-4.3
61.7
65.9
-49.9
TRP-356
ILE-357
10.1
10.3
0.6
-5.7
51.3
51.9
-101.0
ILE-357
SER-358
10.2
10.3
-5.1
4.3
144.0
144.8
-7.8

Graph shows rotational transition at bending residues and can be used
to identify hinge bending residues.
Probably only informative for interdomain rotations greater than 20 degrees