Transcriptional Regulator
(All numbering and residues are taken from first PDB file)
![]()
![]()
Bending Residue Dihedral Analysis
Residue
iResidue
i+1Distance of hinge axis to residue i in
(A) Distance of hinge axis to residue i in
(A) Change in
(deg) Change in
(deg) Angle of psi(i) axis to hinge axis
(deg) Angle of psi(i) axis to hinge axis
(deg) Percentage Progress
HIS-56
GLU-57
2.3
2.7
2.9
-1.9
48.0
48.9
-3.0
GLU-57
LEU-58
4.9
5.5
0.7
0.8
29.9
27.2
11.2
LEU-58
LEU-59
2.9
3.5
1.0
2.6
92.6
89.9
-25.9
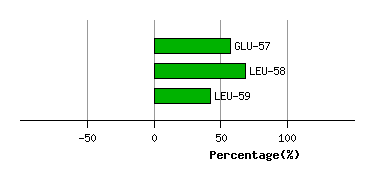
Graph shows rotational transition at bending residues and can be used
to identify hinge bending residues.
Probably only informative for interdomain rotations greater than 20 degrees
Residue
iResidue
i+1Distance of hinge axis to residue i in
(A) Distance of hinge axis to residue i in
(A) Change in
(deg) Change in
(deg) Angle of psi(i) axis to hinge axis
(deg) Angle of psi(i) axis to hinge axis
(deg) Percentage Progress
LEU-88
ALA-89
14.0
14.6
39.9
-11.1
105.8
97.1
-30.3
ALA-89
GLU-90
16.7
17.3
9.3
54.0
132.3
103.6
-114.5
GLU-90
ASN-91
14.8
15.1
143.4
67.6
107.8
31.3
-317.4
ASN-91
VAL-92
11.0
14.6
93.5
95.4
40.1
85.5
774.5
VAL-92
SER-93
9.7
11.2
31.2
43.9
67.1
95.4
201.8
SER-93
ARG-94
10.8
10.5
-60.1
6.4
144.7
156.1
-379.8
ARG-94
PRO-95
10.8
11.1
0.1
-11.6
74.5
78.3
-41.3
PRO-95
GLU-96
7.4
8.1
9.1
-7.4
63.3
77.0
-23.3

Graph shows rotational transition at bending residues and can be used
to identify hinge bending residues.
Probably only informative for interdomain rotations greater than 20 degrees
Residue
iResidue
i+1Distance of hinge axis to residue i in
(A) Distance of hinge axis to residue i in
(A) Change in
(deg) Change in
(deg) Angle of psi(i) axis to hinge axis
(deg) Angle of psi(i) axis to hinge axis
(deg) Percentage Progress
ALA-103
PRO-104
0.8
1.3
-5.2
-4.7
147.0
146.3
-3.3
PRO-104
SER-105
2.0
2.7
13.6
-6.5
68.9
61.9
19.8
SER-105
HIS-106
3.0
2.9
-8.4
4.7
81.2
86.6
13.0
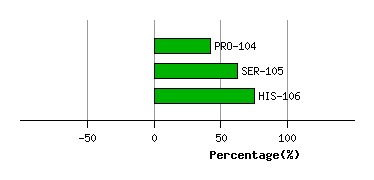
Graph shows rotational transition at bending residues and can be used
to identify hinge bending residues.
Probably only informative for interdomain rotations greater than 20 degrees
Residue
iResidue
i+1Distance of hinge axis to residue i in
(A) Distance of hinge axis to residue i in
(A) Change in
(deg) Change in
(deg) Angle of psi(i) axis to hinge axis
(deg) Angle of psi(i) axis to hinge axis
(deg) Percentage Progress
ASN-111
ALA-112
9.1
9.8
-0.4
10.2
165.1
165.7
83.7
ALA-112
TRP-113
7.2
7.9
-21.4
20.5
102.3
107.0
-20.6
TRP-113
ARG-114
7.2
7.5
-42.9
-6.0
78.0
81.9
24.3
ARG-114
THR-115
10.9
11.0
27.0
-8.6
42.0
39.1
144.1
THR-115
VAL-116
12.2
12.4
20.4
-24.8
90.2
51.7
-34.3
VAL-116
ASN-117
11.0
11.6
10.5
2.9
151.6
119.2
-18.2
ASN-117
HIS-118
11.2
12.5
-16.7
87.3
71.3
82.3
-38.8

Graph shows rotational transition at bending residues and can be used
to identify hinge bending residues.
Probably only informative for interdomain rotations greater than 20 degrees