Putative Enzyme Ydif
(All numbering and residues are taken from first PDB file)
![]()
![]()
Bending Residue Dihedral Analysis
Residue
iResidue
i+1Distance of hinge axis to residue i in
(A) Distance of hinge axis to residue i in
(A) Change in
(deg) Change in
(deg) Angle of psi(i) axis to hinge axis
(deg) Angle of psi(i) axis to hinge axis
(deg) Percentage Progress
PRO-284
LEU-285
21.4
21.5
16.4
4.3
137.5
127.0
-546.3
LEU-285
ASN-286
19.3
19.1
-17.0
17.9
21.9
20.8
-39.1
ASN-286
GLN-287
19.9
20.0
1.2
0.0
123.3
125.7
-163.6
GLN-287
ARG-288
17.6
18.0
-3.4
-2.0
102.2
102.6
53.9
ARG-288
LYS-289
17.2
17.3
4.6
-3.5
35.1
38.7
31.6
LYS-289
LEU-290
16.0
15.9
3.3
-3.6
100.8
102.7
62.2
LEU-290
VAL-291
13.7
13.8
-1.9
1.1
66.4
65.8
-21.3

Graph shows rotational transition at bending residues and can be used
to identify hinge bending residues.
Probably only informative for interdomain rotations greater than 20 degrees
Residue
iResidue
i+1Distance of hinge axis to residue i in
(A) Distance of hinge axis to residue i in
(A) Change in
(deg) Change in
(deg) Angle of psi(i) axis to hinge axis
(deg) Angle of psi(i) axis to hinge axis
(deg) Percentage Progress
GLY-416
THR-417
13.4
13.3
15.6
-18.6
95.7
96.0
18.9
THR-417
LEU-418
14.6
14.4
1.7
1.0
153.9
154.0
-169.4
LEU-418
THR-419
13.2
13.2
-10.1
1.2
39.9
42.7
337.1
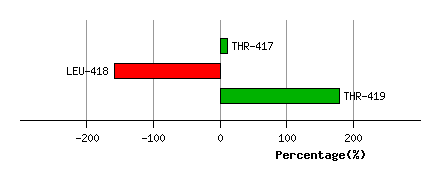
Graph shows rotational transition at bending residues and can be used
to identify hinge bending residues.
Probably only informative for interdomain rotations greater than 20 degrees
Residue
iResidue
i+1Distance of hinge axis to residue i in
(A) Distance of hinge axis to residue i in
(A) Change in
(deg) Change in
(deg) Angle of psi(i) axis to hinge axis
(deg) Angle of psi(i) axis to hinge axis
(deg) Percentage Progress
GLY-430
LYS-431
18.7
18.6
6.5
-5.1
11.4
14.8
191.2
LYS-431
LEU-432
19.0
19.3
-13.8
2.7
115.7
120.3
41.0
LEU-432
ASN-433
18.7
18.8
3.0
-11.6
53.9
51.8
-311.0
ASN-433
ILE-434
22.0
21.9
2.0
-0.9
50.3
54.0
135.8
ILE-434
VAL-435
22.0
21.9
-5.3
12.9
105.1
106.4
228.2

Graph shows rotational transition at bending residues and can be used
to identify hinge bending residues.
Probably only informative for interdomain rotations greater than 20 degrees
Residue
iResidue
i+1Distance of hinge axis to residue i in
(A) Distance of hinge axis to residue i in
(A) Change in
(deg) Change in
(deg) Angle of psi(i) axis to hinge axis
(deg) Angle of psi(i) axis to hinge axis
(deg) Percentage Progress
ILE-444
ARG-445
10.1
9.9
-2.5
4.9
114.5
117.5
104.5
ARG-445
GLU-446
7.4
7.3
2.9
-8.9
92.9
92.3
29.0
GLU-446
LEU-447
8.8
8.8
-2.2
-6.2
73.1
73.2
-83.1

Graph shows rotational transition at bending residues and can be used
to identify hinge bending residues.
Probably only informative for interdomain rotations greater than 20 degrees
Residue
iResidue
i+1Distance of hinge axis to residue i in
(A) Distance of hinge axis to residue i in
(A) Change in
(deg) Change in
(deg) Angle of psi(i) axis to hinge axis
(deg) Angle of psi(i) axis to hinge axis
(deg) Percentage Progress
TYR-466
ILE-467
5.7
5.7
3.3
-1.5
56.9
58.6
54.7
ILE-467
THR-468
7.5
7.5
1.2
-1.3
108.1
108.5
37.5
THR-468
GLU-469
10.6
10.6
-7.4
11.0
133.5
132.8
24.6
GLU-469
ARG-470
13.2
13.2
-3.6
0.5
81.8
82.2
33.8
ARG-470
ALA-471
13.0
12.9
-2.4
8.1
77.7
75.8
-140.5

Graph shows rotational transition at bending residues and can be used
to identify hinge bending residues.
Probably only informative for interdomain rotations greater than 20 degrees
Residue
iResidue
i+1Distance of hinge axis to residue i in
(A) Distance of hinge axis to residue i in
(A) Change in
(deg) Change in
(deg) Angle of psi(i) axis to hinge axis
(deg) Angle of psi(i) axis to hinge axis
(deg) Percentage Progress
ASP-478
GLY-479
5.9
6.0
-6.8
10.7
95.2
93.7
2.7
GLY-479
LEU-480
2.4
2.5
0.3
1.6
23.2
23.3
109.5
LEU-480
HIS-481
0.5
0.5
-1.0
-1.6
104.3
102.5
-30.4

Graph shows rotational transition at bending residues and can be used
to identify hinge bending residues.
Probably only informative for interdomain rotations greater than 20 degrees
Residue
iResidue
i+1Distance of hinge axis to residue i in
(A) Distance of hinge axis to residue i in
(A) Change in
(deg) Change in
(deg) Angle of psi(i) axis to hinge axis
(deg) Angle of psi(i) axis to hinge axis
(deg) Percentage Progress
ILE-485
ALA-486
11.1
11.3
4.2
-9.6
139.6
143.0
64.3
ALA-486
PRO-487
13.4
13.4
-1.4
-3.2
87.8
89.0
-229.2
PRO-487
GLY-488
16.5
16.6
0.5
3.9
68.5
71.2
131.6
GLY-488
VAL-489
19.6
19.6
1.5
-3.6
17.9
18.7
16.3
VAL-489
ASP-490
17.9
17.9
-5.9
3.3
127.1
125.0
-77.0
ASP-490
LEU-491
18.4
18.4
-3.4
7.5
123.1
123.1
40.5

Graph shows rotational transition at bending residues and can be used
to identify hinge bending residues.
Probably only informative for interdomain rotations greater than 20 degrees
Residue
iResidue
i+1Distance of hinge axis to residue i in
(A) Distance of hinge axis to residue i in
(A) Change in
(deg) Change in
(deg) Angle of psi(i) axis to hinge axis
(deg) Angle of psi(i) axis to hinge axis
(deg) Percentage Progress
THR-502
PRO-503
6.6
6.5
-8.2
1.5
49.9
47.5
165.2
PRO-503
VAL-504
5.1
5.1
2.0
-7.3
95.8
94.6
18.7
VAL-504
ILE-505
6.4
6.5
1.8
-4.1
144.6
146.9
144.6
ILE-505
SER-506
9.0
9.0
5.7
-9.2
55.6
57.6
218.8
ILE-505
SER-506
9.0
9.0
5.7
-9.2
55.6
57.6
218.8

Graph shows rotational transition at bending residues and can be used
to identify hinge bending residues.
Probably only informative for interdomain rotations greater than 20 degrees
Residue
iResidue
i+1Distance of hinge axis to residue i in
(A) Distance of hinge axis to residue i in
(A) Change in
(deg) Change in
(deg) Angle of psi(i) axis to hinge axis
(deg) Angle of psi(i) axis to hinge axis
(deg) Percentage Progress
ILE-505
SER-506
9.0
9.0
5.7
-9.2
55.6
57.6
218.8
ILE-505
SER-506
9.0
9.0
5.7
-9.2
55.6
57.6
218.8
SER-506
PRO-507
9.1
9.2
-1.9
6.1
103.0
106.3
4.1
PRO-507
GLU-508
12.8
12.8
-8.1
6.4
167.9
168.2
-90.4

Graph shows rotational transition at bending residues and can be used
to identify hinge bending residues.
Probably only informative for interdomain rotations greater than 20 degrees
Residue
iResidue
i+1Distance of hinge axis to residue i in
(A) Distance of hinge axis to residue i in
(A) Change in
(deg) Change in
(deg) Angle of psi(i) axis to hinge axis
(deg) Angle of psi(i) axis to hinge axis
(deg) Percentage Progress
LEU-509
LYS-510
10.5
10.6
2.4
0.2
142.9
142.0
8.5
LYS-510
LEU-511
11.3
11.4
10.2
-14.5
97.5
94.5
93.6

Graph shows rotational transition at bending residues and can be used
to identify hinge bending residues.
Probably only informative for interdomain rotations greater than 20 degrees
Residue
iResidue
i+1Distance of hinge axis to residue i in
(A) Distance of hinge axis to residue i in
(A) Change in
(deg) Change in
(deg) Angle of psi(i) axis to hinge axis
(deg) Angle of psi(i) axis to hinge axis
(deg) Percentage Progress
LEU-516
PHE-517
11.8
11.8
7.2
2.4
97.8
98.5
-71.4
PHE-517
ILE-518
15.5
15.5
-12.6
13.6
139.8
142.2
36.8
ILE-518
ASP-519
16.7
16.6
4.5
-1.7
61.7
64.7
26.1
ASP-519
ALA-520
18.4
18.2
-5.6
0.3
169.1
165.8
-180.8

Graph shows rotational transition at bending residues and can be used
to identify hinge bending residues.
Probably only informative for interdomain rotations greater than 20 degrees