Nad-Dependent Malic Enzyme, Mitochondrial
(All numbering and residues are taken from first PDB file)
![]()
![]()
Bending Residue Dihedral Analysis
Residue
iResidue
i+1Distance of hinge axis to residue i in
(A) Distance of hinge axis to residue i in
(A) Change in
(deg) Change in
(deg) Angle of psi(i) axis to hinge axis
(deg) Angle of psi(i) axis to hinge axis
(deg) Percentage Progress
ILE-88
GLN-89
14.6
14.7
-20.1
-2.8
74.1
69.7
248.5
GLN-89
GLU-90
11.2
11.4
55.6
-32.0
64.6
57.3
207.0
GLU-90
ARG-91
12.1
12.3
-16.7
-5.9
87.3
86.4
46.2

Graph shows rotational transition at bending residues and can be used
to identify hinge bending residues.
Probably only informative for interdomain rotations greater than 20 degrees
Residue
iResidue
i+1Distance of hinge axis to residue i in
(A) Distance of hinge axis to residue i in
(A) Change in
(deg) Change in
(deg) Angle of psi(i) axis to hinge axis
(deg) Angle of psi(i) axis to hinge axis
(deg) Percentage Progress
ILE-99
LEU-100
14.5
14.9
-6.9
4.7
92.0
92.6
16.5
LEU-100
GLN-101
11.5
11.9
29.1
-17.4
24.4
25.4
220.2
GLN-101
ASP-102
10.8
11.5
-21.1
8.7
115.2
116.0
-122.3

Graph shows rotational transition at bending residues and can be used
to identify hinge bending residues.
Probably only informative for interdomain rotations greater than 20 degrees
Residue
iResidue
i+1Distance of hinge axis to residue i in
(A) Distance of hinge axis to residue i in
(A) Change in
(deg) Change in
(deg) Angle of psi(i) axis to hinge axis
(deg) Angle of psi(i) axis to hinge axis
(deg) Percentage Progress
ALA-119
CYS-120
9.9
9.9
-11.9
10.5
115.3
124.1
-4.3
CYS-120
SER-121
7.8
7.8
9.0
-2.2
19.0
21.9
123.1
SER-121
GLN-122
10.1
10.2
-12.7
20.7
125.8
123.4
36.1

Graph shows rotational transition at bending residues and can be used
to identify hinge bending residues.
Probably only informative for interdomain rotations greater than 20 degrees
Residue
iResidue
i+1Distance of hinge axis to residue i in
(A) Distance of hinge axis to residue i in
(A) Change in
(deg) Change in
(deg) Angle of psi(i) axis to hinge axis
(deg) Angle of psi(i) axis to hinge axis
(deg) Percentage Progress
ARG-194
PRO-195
7.6
7.1
13.6
-19.2
172.5
172.6
124.6
PRO-195
ASP-196
7.2
6.9
23.5
-7.3
118.9
121.0
-245.5
ASP-196
ARG-197
10.4
10.1
-19.1
8.9
104.4
92.8
10.5
ARG-197
CYS-198
9.7
9.4
30.9
-9.4
119.4
115.8
-180.8
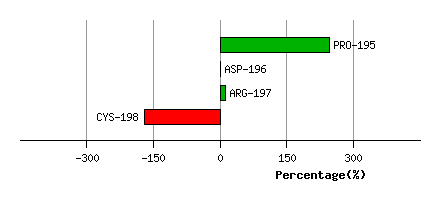
Graph shows rotational transition at bending residues and can be used
to identify hinge bending residues.
Probably only informative for interdomain rotations greater than 20 degrees
Residue
iResidue
i+1Distance of hinge axis to residue i in
(A) Distance of hinge axis to residue i in
(A) Change in
(deg) Change in
(deg) Angle of psi(i) axis to hinge axis
(deg) Angle of psi(i) axis to hinge axis
(deg) Percentage Progress
VAL-478
ILE-479
10.9
10.8
-7.1
0.0
77.2
77.3
19.6
ILE-479
LEU-480
10.1
9.9
30.9
-13.8
38.8
36.3
223.9
LEU-480
CYS-481
10.4
9.8
-13.7
3.7
124.2
121.7
-146.2

Graph shows rotational transition at bending residues and can be used
to identify hinge bending residues.
Probably only informative for interdomain rotations greater than 20 degrees
Residue
iResidue
i+1Distance of hinge axis to residue i in
(A) Distance of hinge axis to residue i in
(A) Change in
(deg) Change in
(deg) Angle of psi(i) axis to hinge axis
(deg) Angle of psi(i) axis to hinge axis
(deg) Percentage Progress
THR-483
ARG-484
15.8
15.7
6.6
-19.4
27.9
23.0
-185.6
ARG-484
HIS-485
18.5
18.1
13.3
-3.5
56.7
62.5
93.3
HIS-485
ILE-486
18.5
18.5
5.2
-27.3
114.2
117.7
179.3

Graph shows rotational transition at bending residues and can be used
to identify hinge bending residues.
Probably only informative for interdomain rotations greater than 20 degrees
Residue
iResidue
i+1Distance of hinge axis to residue i in
(A) Distance of hinge axis to residue i in
(A) Change in
(deg) Change in
(deg) Angle of psi(i) axis to hinge axis
(deg) Angle of psi(i) axis to hinge axis
(deg) Percentage Progress
LYS-554
GLU-555
3.8
3.7
-10.1
7.1
82.4
81.2
92.7
GLU-555
ARG-556
7.4
7.4
24.8
-14.5
163.8
157.3
-154.2
ARG-556
THR-557
7.5
7.6
-46.5
45.7
43.3
40.8
97.7

Graph shows rotational transition at bending residues and can be used
to identify hinge bending residues.
Probably only informative for interdomain rotations greater than 20 degrees